
Stellar Price Forecast: Record stablecoin growth fuels XLM recovery
Von Manish Chhetri
Aktualisiert: 3 Jul 2026


BELIEBTE ARTIKEL

Stellar (XLM) price holds above its 200-day Exponential Moving Average (EMA) at $0.197 on Friday after rallying more than 14% this week. The recovery is supported by robust on-chain activity, with Stellar’s stablecoin market capitalization climbing to a record high and TVL continuing to rise.
- Stellar price trades above its 200-day EMA at $0.197 on Friday after rallying more than 14% this week.
- Record stablecoin market capitalization and rising Total Value Locked signal strengthening on-chain activity.
- Improving momentum indicators and a bullish technical setup suggest XLM could extend its recovery.
Stellar (XLM) price holds above its 200-day Exponential Moving Average (EMA) at $0.197 on Friday after rallying more than 14% this week. The recovery is supported by robust on-chain activity, with Stellar’s stablecoin market capitalization climbing to a record high and TVL continuing to rise. In addition, improving momentum indicators and a strengthening technical outlook suggest XLM could have room to extend its gains.
Strengthening on-chain activity supports a bullish bias
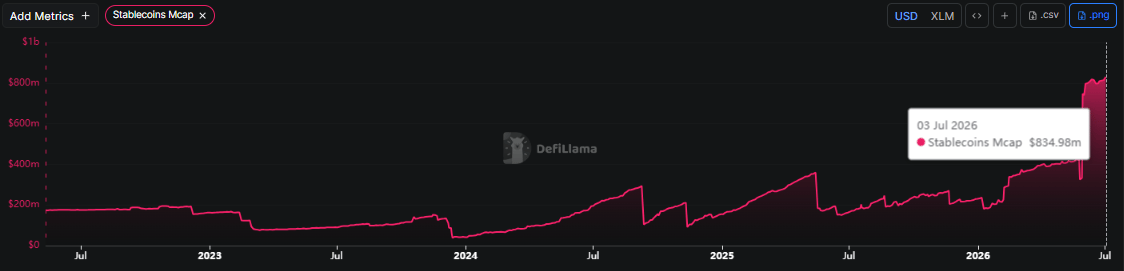
Crypto intelligence tracker DefiLlama data shows that Stellar’s stablecoin market capitalization surged to a record high of 4834.98 million on Friday. This surge indicates continued growth in on-chain liquidity and stablecoin usage, which could support XLM’s long-term price outlook.
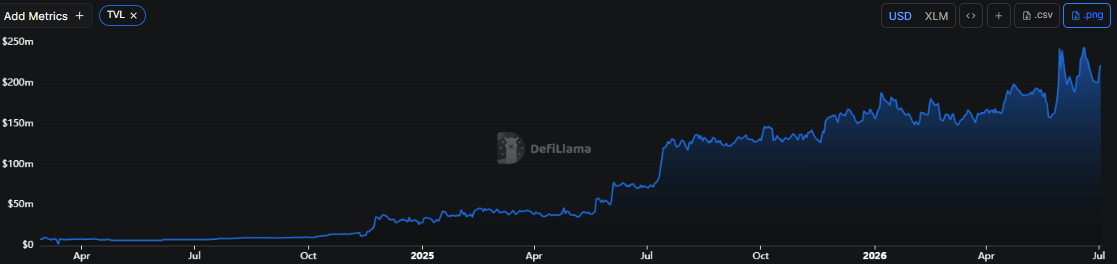
In addition, Stellar’s TVL increased from $199 million on Monday to $223 million on Friday, indicating growing activity and interest within the ecosystem. It suggests that more users are depositing or utilizing assets within XLM-based protocols, adding further bullish credence.
Stellar Price Forecast: XLM closes above key 200-day EMA
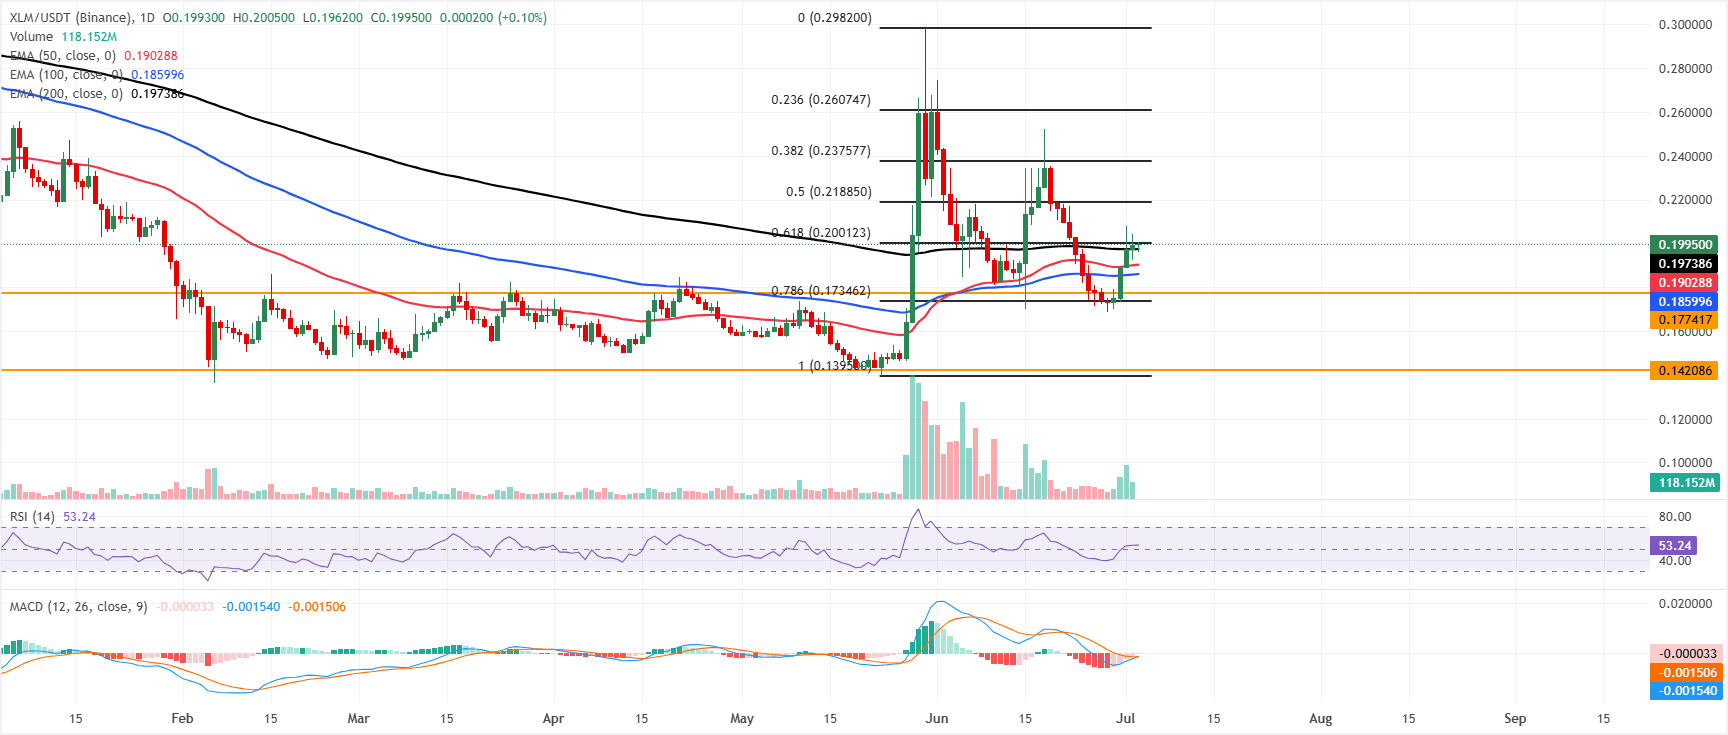
Stellar price trades above $0.199 on Friday, up over 15% so far this week. XLM is holding a modestly bullish near-term bias as price sits above the 50-day, 100-day, and 200-day Exponential Moving Averages (EMAs), which cluster between roughly $0.186 and $0.197, suggesting underlying demand on dips.
The Relative Strength Index (RSI) at about 53 keeps a neutral-to-positive tone, while the Moving Average Convergence Divergence (MACD) indicator hovers around the zero line, hinting at a consolidative phase rather than an impulsive breakout.
On the topside, initial resistance is defined by the 61.8% Fibonacci retracement at $0.200, with further barriers at the 50% retracement near $0.218 and subsequent Fibonacci levels at $0.237 and $0.260.
On the downside, immediate support is seen at the 200-day EMA around $0.197, followed by the 50-day EMA near $0.190 and the 100-day EMA at $0.186; a deeper pullback would expose the horizontal support at $0.177 and the 78.6% Fibonacci retracement at $0.173, ahead of a more distant floor near $0.142.
(The technical analysis of this story was written with the help of an AI tool.)

Über eine Million Nutzer verlassen sich auf FXStreet für Echtzeit-Marktdaten, Charting-Tools, Experteneinblicke und Forex-News. Der umfassende Wirtschaftskalender und die Bildungs-Webinare helfen Tradern, informiert zu bleiben und fundierte Entscheidungen zu treffen. FXStreet wird von einem Team von rund 60 Fachleuten getragen, verteilt auf den Hauptsitz in Barcelona und verschiedene Regionen weltweit.
Weiterlesen


