
Sui Price Forecast: Bearish outlook strengthens amid positional unwinding
Von Vishal Dixit
Aktualisiert: 15 May 2026


BELIEBTE ARTIKEL

Sui (SUI) is down roughly 3% at press time on Friday, extending a five-day decline so far this week. Retail demand for the SUI token is waning as the market shifts attention away from underperforming layer-1 tokens. The technical outlook is bearish, pointing to a double-digit drop to $1.00.
- Sui is down nearly 3% on Friday, extending its decline for the fifth consecutive day.
- Derivatives data shows intense unwinding of bullish positions over the last 24 hours.
- The technical outlook for SUI is bearish, with a risk of a steeper decline toward $1.00.
Sui (SUI) is down roughly 3% at press time on Friday, extending a five-day decline so far this week. Retail demand for the SUI token is waning as the market shifts attention away from underperforming layer-1 tokens. The technical outlook is bearish, pointing to a double-digit drop to $1.00.
Bullish positional unwinding in SUI derivatives
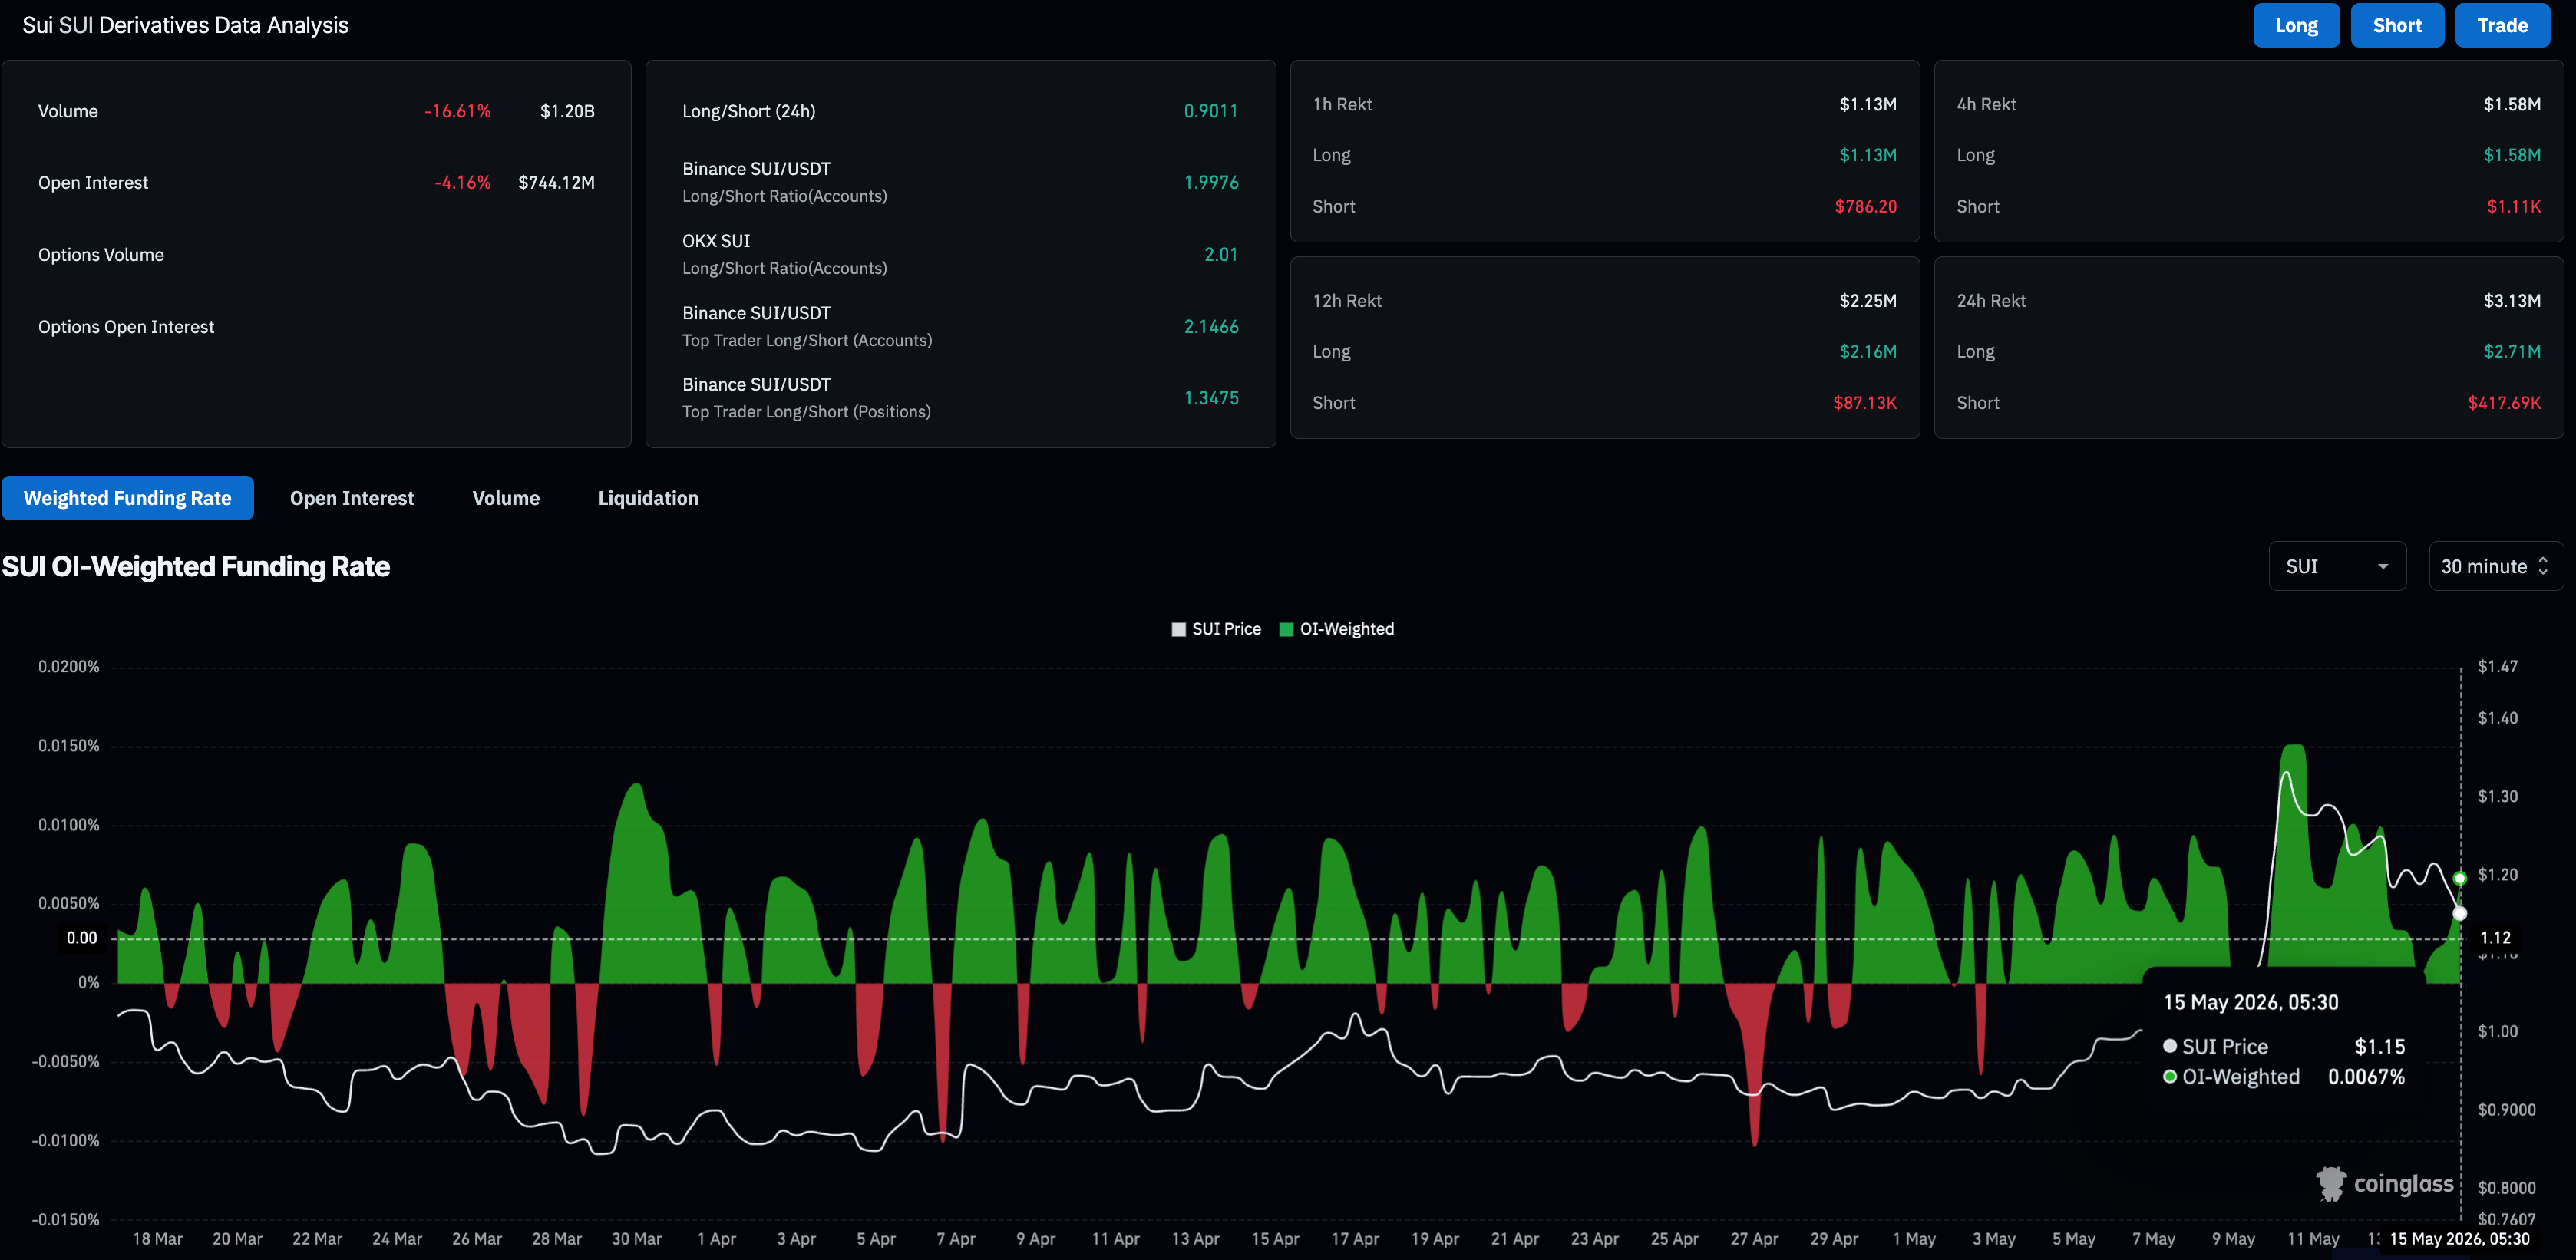
Sui is losing investor demand in the derivatives market, in line with falling spot prices. CoinGlass data shows the SUI futures Open Interest (OI) is down 4% over the last 24 hours to $744.12 million, reflecting a reduced notional value of outstanding contracts.
Data also shows $3.13 million in positions were liquidated in the last 24 hours, led by $2.71 million in long liquidations, suggesting a sell-side dominance.
Technical outlook: Will SUI price drop to $1?
SUI is extending a steady decline this week, totaling roughly a 14% loss so far. On the 4-hour chart, the price is holding close to the 50-period Exponential Moving Average (EMA) at $1.1558 and the lower Bollinger Band near $1.1442, reflecting a short-term bearish bias.
However, the pair still sits comfortably above the 200-period EMA at $1.0270, suggesting the broader recovery structure is intact, but momentum has deteriorated. The Relative Strength Index (RSI) slips to 40, below the midline, as selling pressure grows, while the Moving Average Convergence Divergence (MACD) histogram remains in negative territory, hinting that rallies are likely to face selling pressure while the price is capped beneath the short-term average and descending trend resistance.
On the downside, the first notable demand zone emerges around the 50% retracement at $1.1519, measured over the upswing from $0.8815 to $1.4223, reinforced by the 50-period EMA at $1.1558, while deeper losses would expose the 200-day EMA at $1.0270, close to the 78.6% Fibonacci retracement at $0.9972 before the prior cycle low region at $0.8815.
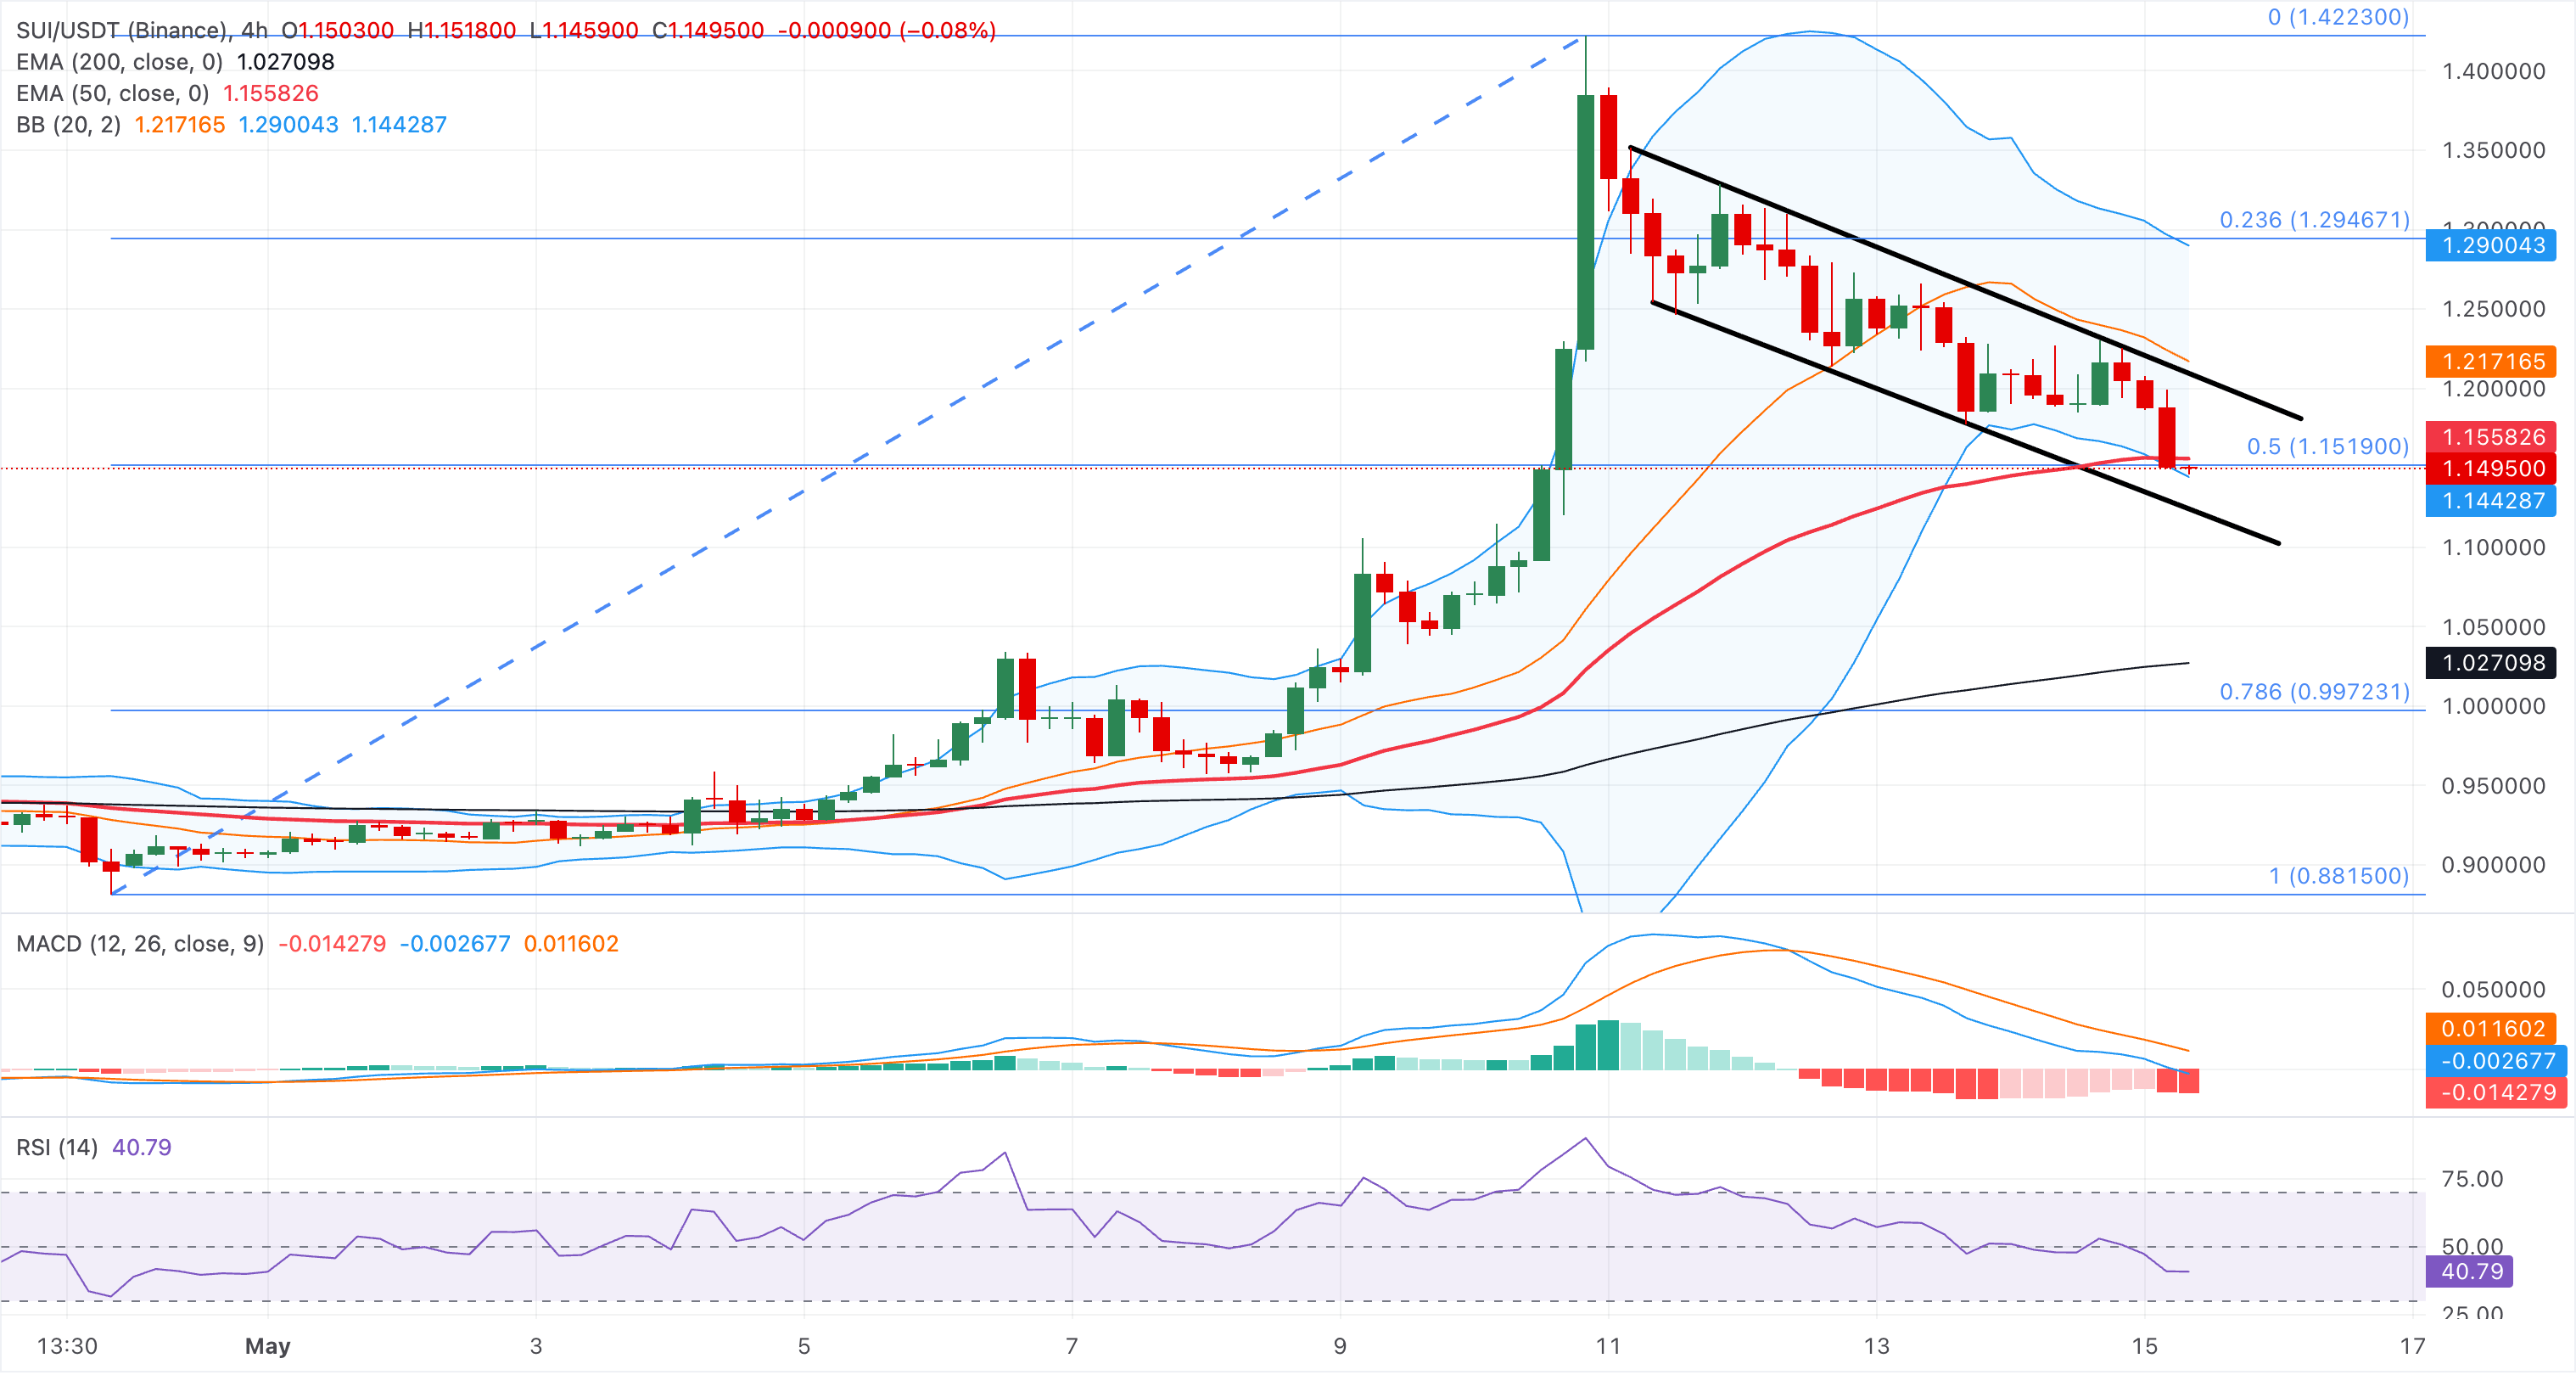
On the topside, a rebound from the 50% Fibonacci retracement at $1.1519 could test the Bollinger Bands midline at $1.2171, followed by the upper Bollinger Band around $1.2900 and the 23.6% Fibonacci retracement level at 1.2947.
(The technical analysis of this story was written with the help of an AI tool.)

Über eine Million Nutzer verlassen sich auf FXStreet für Echtzeit-Marktdaten, Charting-Tools, Experteneinblicke und Forex-News. Der umfassende Wirtschaftskalender und die Bildungs-Webinare helfen Tradern, informiert zu bleiben und fundierte Entscheidungen zu treffen. FXStreet wird von einem Team von rund 60 Fachleuten getragen, verteilt auf den Hauptsitz in Barcelona und verschiedene Regionen weltweit.
Weiterlesen


