
Top 3 Price Prediction: Bitcoin, Ethereum, Ripple – BTC, ETH and XRP weakness persists after massive correction
Von Manish Chhetri
Veröffentlichungsdatum: 2 Feb 2026 | Änderungsdatum: 2 Feb 2026


BELIEBTE ARTIKEL

Bitcoin (BTC), Ethereum (ETH) and Ripple (XRP) trade in red on Monday after dipping by over 11%, 19% and 13%, respectively, in the previous week. The top three cryptocurrencies have shed 10%, 17%, and 10.5% in the first month of 2026, highlighting persistent downside pressure.
- Bitcoin price trades below $75,000 on Monday after correcting by over 11% in the previous week.
- Ethereum extends correction trading at $2,270 after hitting a seven-month low last week.
- XRP trades at $1.59 after posting four consecutive red weekly candles since early January.
Bitcoin (BTC), Ethereum (ETH) and Ripple (XRP) trade in red on Monday after dipping by over 11%, 19% and 13%, respectively, in the previous week. The top three cryptocurrencies have shed 10%, 17%, and 10.5% in the first month of 2026, highlighting persistent downside pressure. BTC is extending its correction, slipping below $75,000 after posting double-digit weekly losses, while Ethereum trades at $2,270 after hitting a seven-month low. XRP remains under pressure near $1.59, extending its bearish streak with multiple consecutive red weekly candles.
BTC bears aiming for the $70,000 mark
Bitcoin price closed below the lower boundary of the horizontal channel pattern at $85,569 on Thursday and corrected by over 9% through Sunday. At the time of writing on Monday, BTC is trading at $74,800.
If BTC continues its correction, it could extend the decline toward the key psychological level at $70,000.
The Relative Strength Index (RSI) on the daily chart reads 20, an extreme oversold condition, indicating strong bearish momentum. The Moving Average Convergence Divergence (MACD) also showed a bearish crossover on January 20, which remains intact with rising red histogram bars below the neutral level, further supporting the negative outlook.
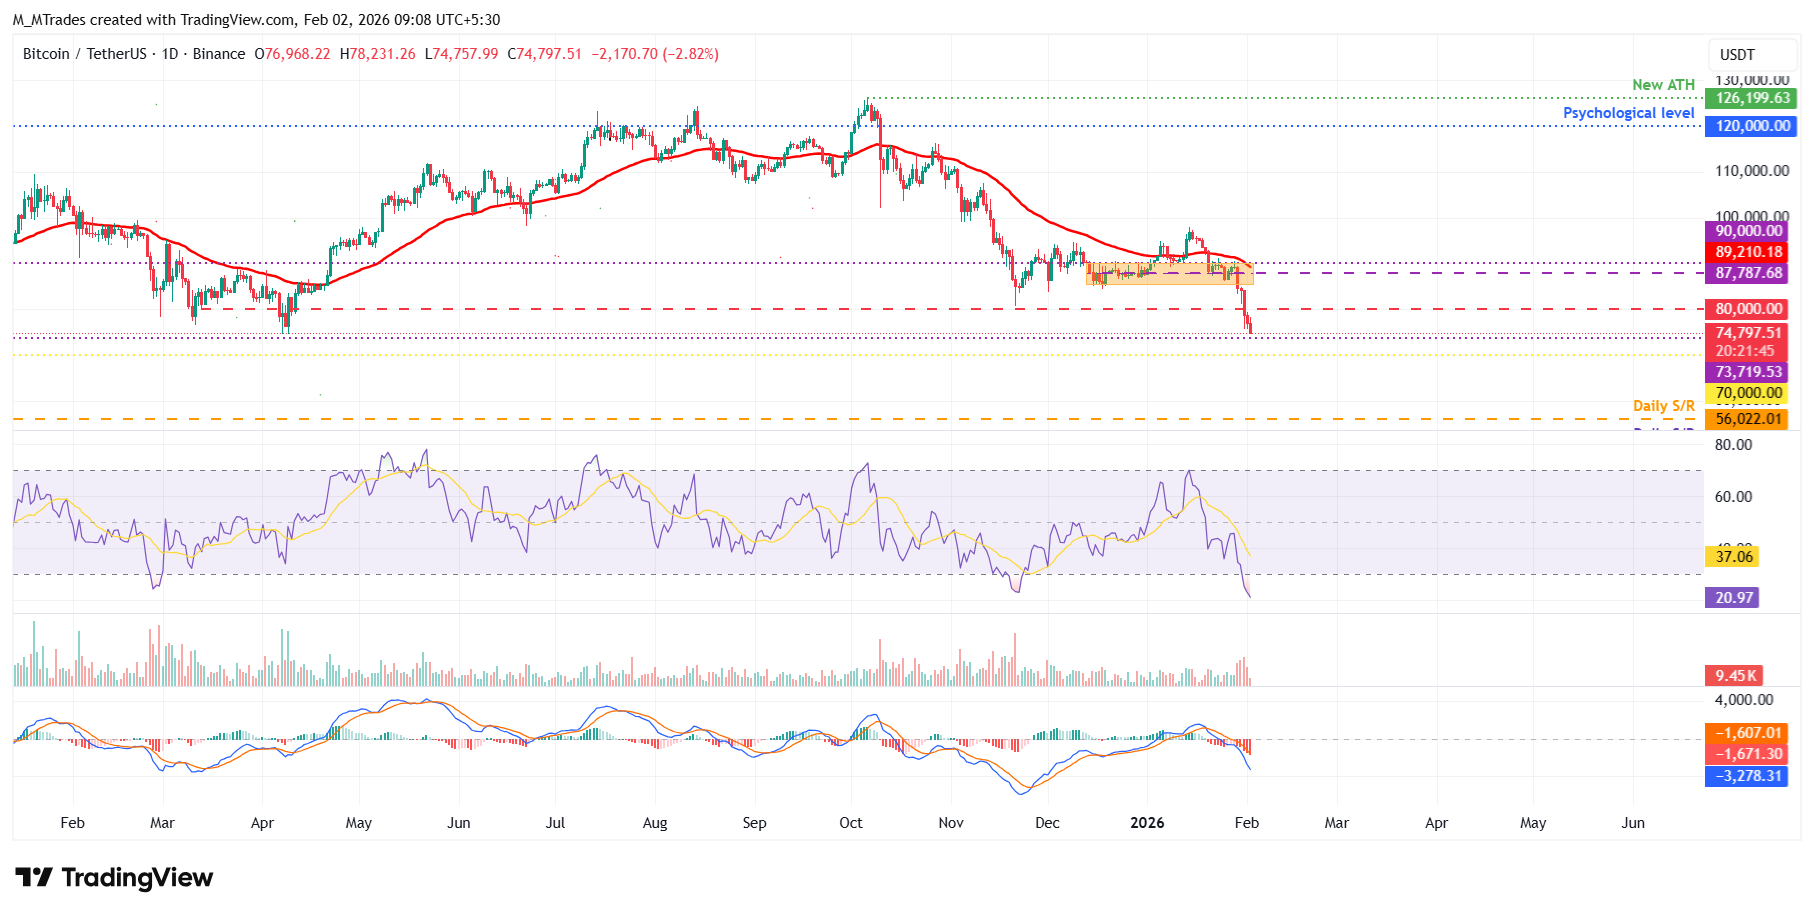
On the other hand, if BTC recovers, it could extend the advance toward the key psychological level at $80,000.
Ethereum targeting lows not seen since the end of June
Ethereum price closed below the 61.8% Fibonacci retracement level at $2,749 on Friday and declined by over 16% in the next two days. As of Monday, ETH is trading below $2,259.
If ETH continues its downward trend, it could extend the decline toward the June 22 low of $2,111.
Like Bitcoin, Ethereum RSI and MACD indicators on the daily chart are showing strong bearish strength.
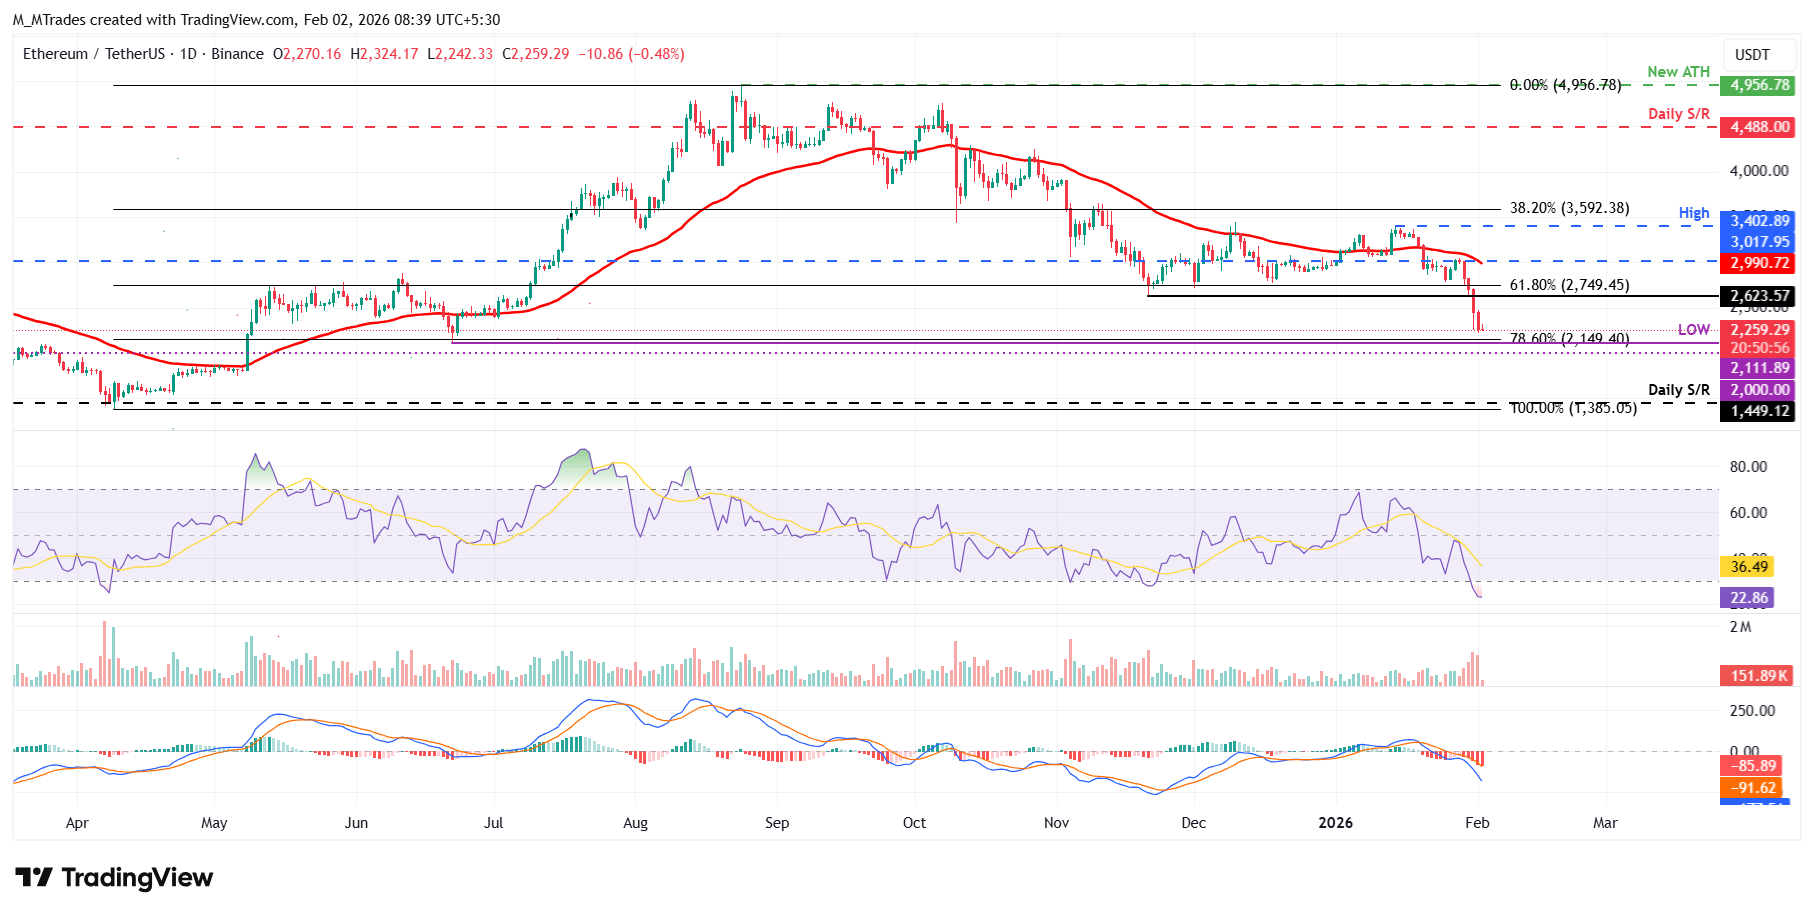
However, if ETH recovers, it could extend the advance toward the key psychological level at $2,500.
XRP bears are in control of the momentum
XRP price closed below the daily support at $1.83 on Thursday and declined 12% in the next three days. As of Monday, XRP is trading at $1.57.
If XRP continues its downward momentum, it could extend the weekly support at $1.30.
Like Bitcoin and Ethereum, XRP’s momentum indicators (RSI and MACD) are also projecting a bearish outlook.
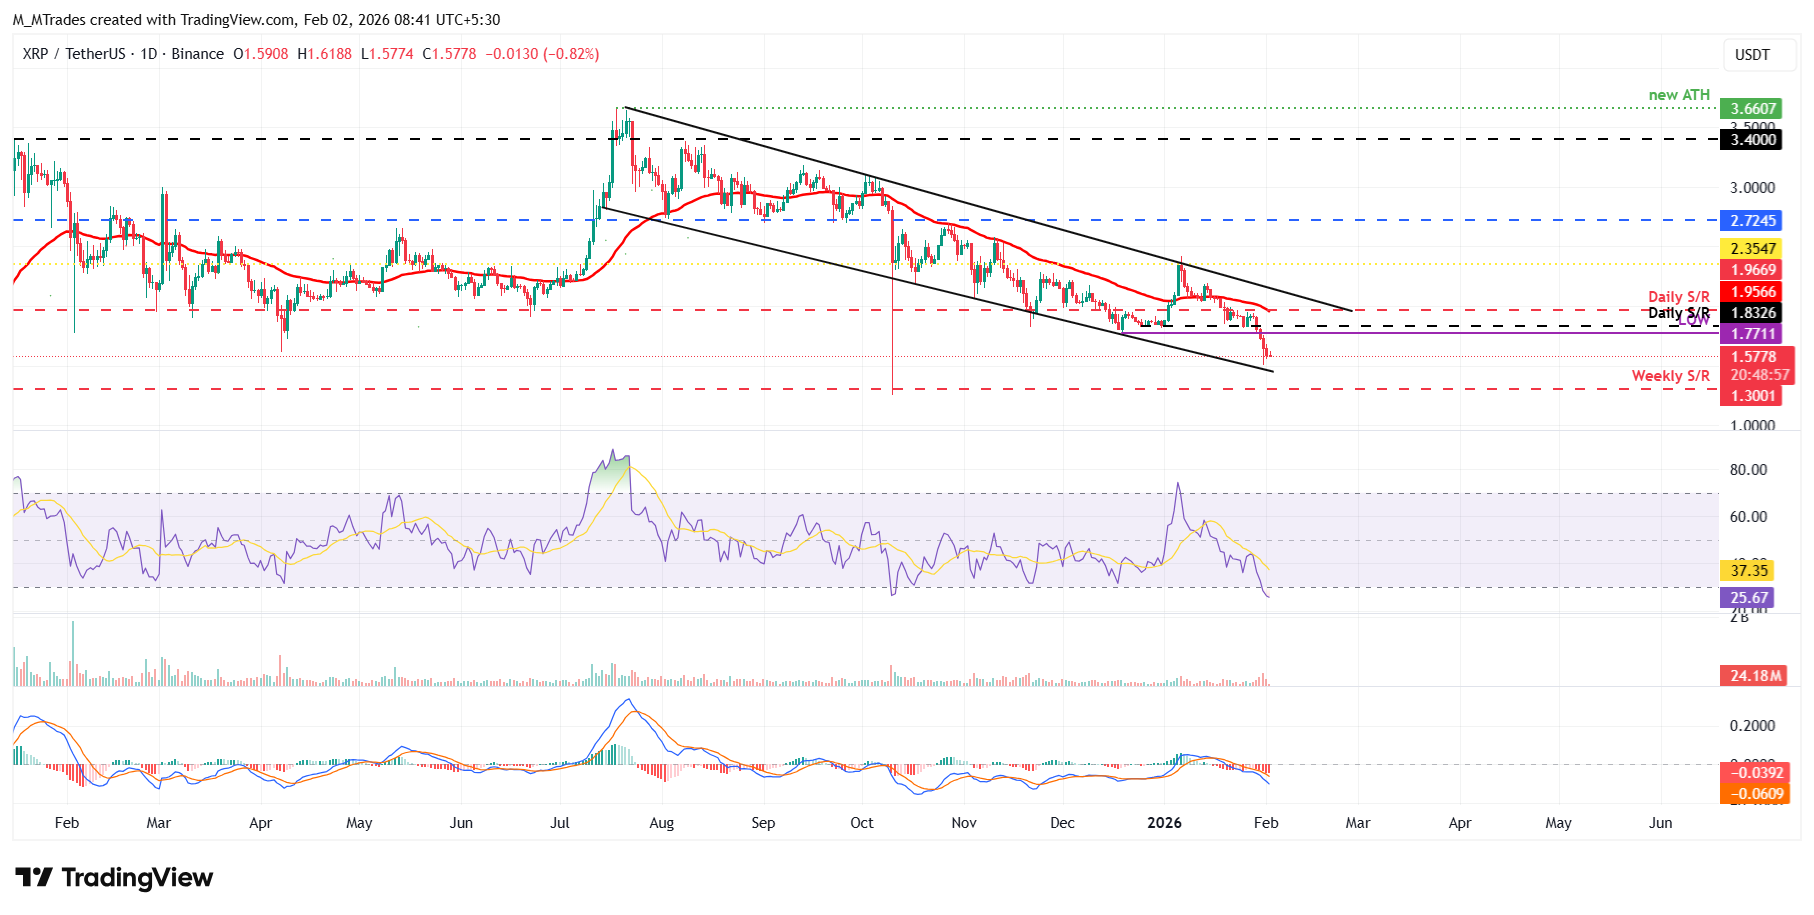
Conversely, if XRP recovers, it could extend the advance toward the previously broken daily level at $1.83.
Cryptocurrency prices FAQs
Token launches influence demand and adoption among market participants. Listings on crypto exchanges deepen the liquidity for an asset and add new participants to an asset’s network. This is typically bullish for a digital asset.
A hack is an event in which an attacker captures a large volume of the asset from a DeFi bridge or hot wallet of an exchange or any other crypto platform via exploits, bugs or other methods. The exploiter then transfers these tokens out of the exchange platforms to ultimately sell or swap the assets for other cryptocurrencies or stablecoins. Such events often involve an en masse panic triggering a sell-off in the affected assets.
Macroeconomic events like the US Federal Reserve’s decision on interest rates influence crypto assets mainly through the direct impact they have on the US Dollar. An increase in interest rate typically negatively influences Bitcoin and altcoin prices, and vice versa. If the US Dollar index declines, risk assets and associated leverage for trading gets cheaper, in turn driving crypto prices higher.
Halvings are typically considered bullish events as they slash the block reward in half for miners, constricting the supply of the asset. At consistent demand if the supply reduces, the asset’s price climbs.

Über eine Million Nutzer verlassen sich auf FXStreet für Echtzeit-Marktdaten, Charting-Tools, Experteneinblicke und Forex-News. Der umfassende Wirtschaftskalender und die Bildungs-Webinare helfen Tradern, informiert zu bleiben und fundierte Entscheidungen zu treffen. FXStreet wird von einem Team von rund 60 Fachleuten getragen, verteilt auf den Hauptsitz in Barcelona und verschiedene Regionen weltweit.
Weiterlesen


