
Two reasons to be bearish on Shiba Inu
Von John Isige
Aktualisiert: 2 Apr 2026


BELIEBTE ARTIKEL

Shiba Inu (SHIB) has corrected from its daily open of $0.0000060 to trade around $0.0000058 at the time of writing on Thursday.
- Shiba Inu extends its pullback below the daily open of $0.0000060 as volatility intensifies.
- Investors are increasingly betting on further downside momentum as the Shiba Inu Open Interest-weighted funding rate falls deeper into negative territory.
- The Shiba Inu derivatives market remains weak despite futures Open Interest steadying at $52 million.
Shiba Inu (SHIB) has corrected from its daily open of $0.0000060 to trade around $0.0000058 at the time of writing on Thursday. The meme coin’s technical levels remain significantly depressed, weighed down by widespread risk-off sentiment due to the United States (US) and Israel’s war with Iran and sticky macroeconomic uncertainty.
1. OI-weighted funding rate cools amid bearish bets
Interest in Shiba Inu derivatives is on the back foot, as reflected by the Open Interest (OI)-Weighted Funding Rate, which stands at -0.0265% on Thursday, indicating that bearish bets currently outweigh bullish exposure. The drop into negative territory also suggests that bullish conviction is cooling as the market transitions to a more bearish stance.
As the funding rate drops, buyers become exhausted and close their positions. Meanwhile, bearish positions increase, keeping the asset’s price suppressed. Hence, Shiba Inu’s outlook may deteriorate further, leading to extended losses.
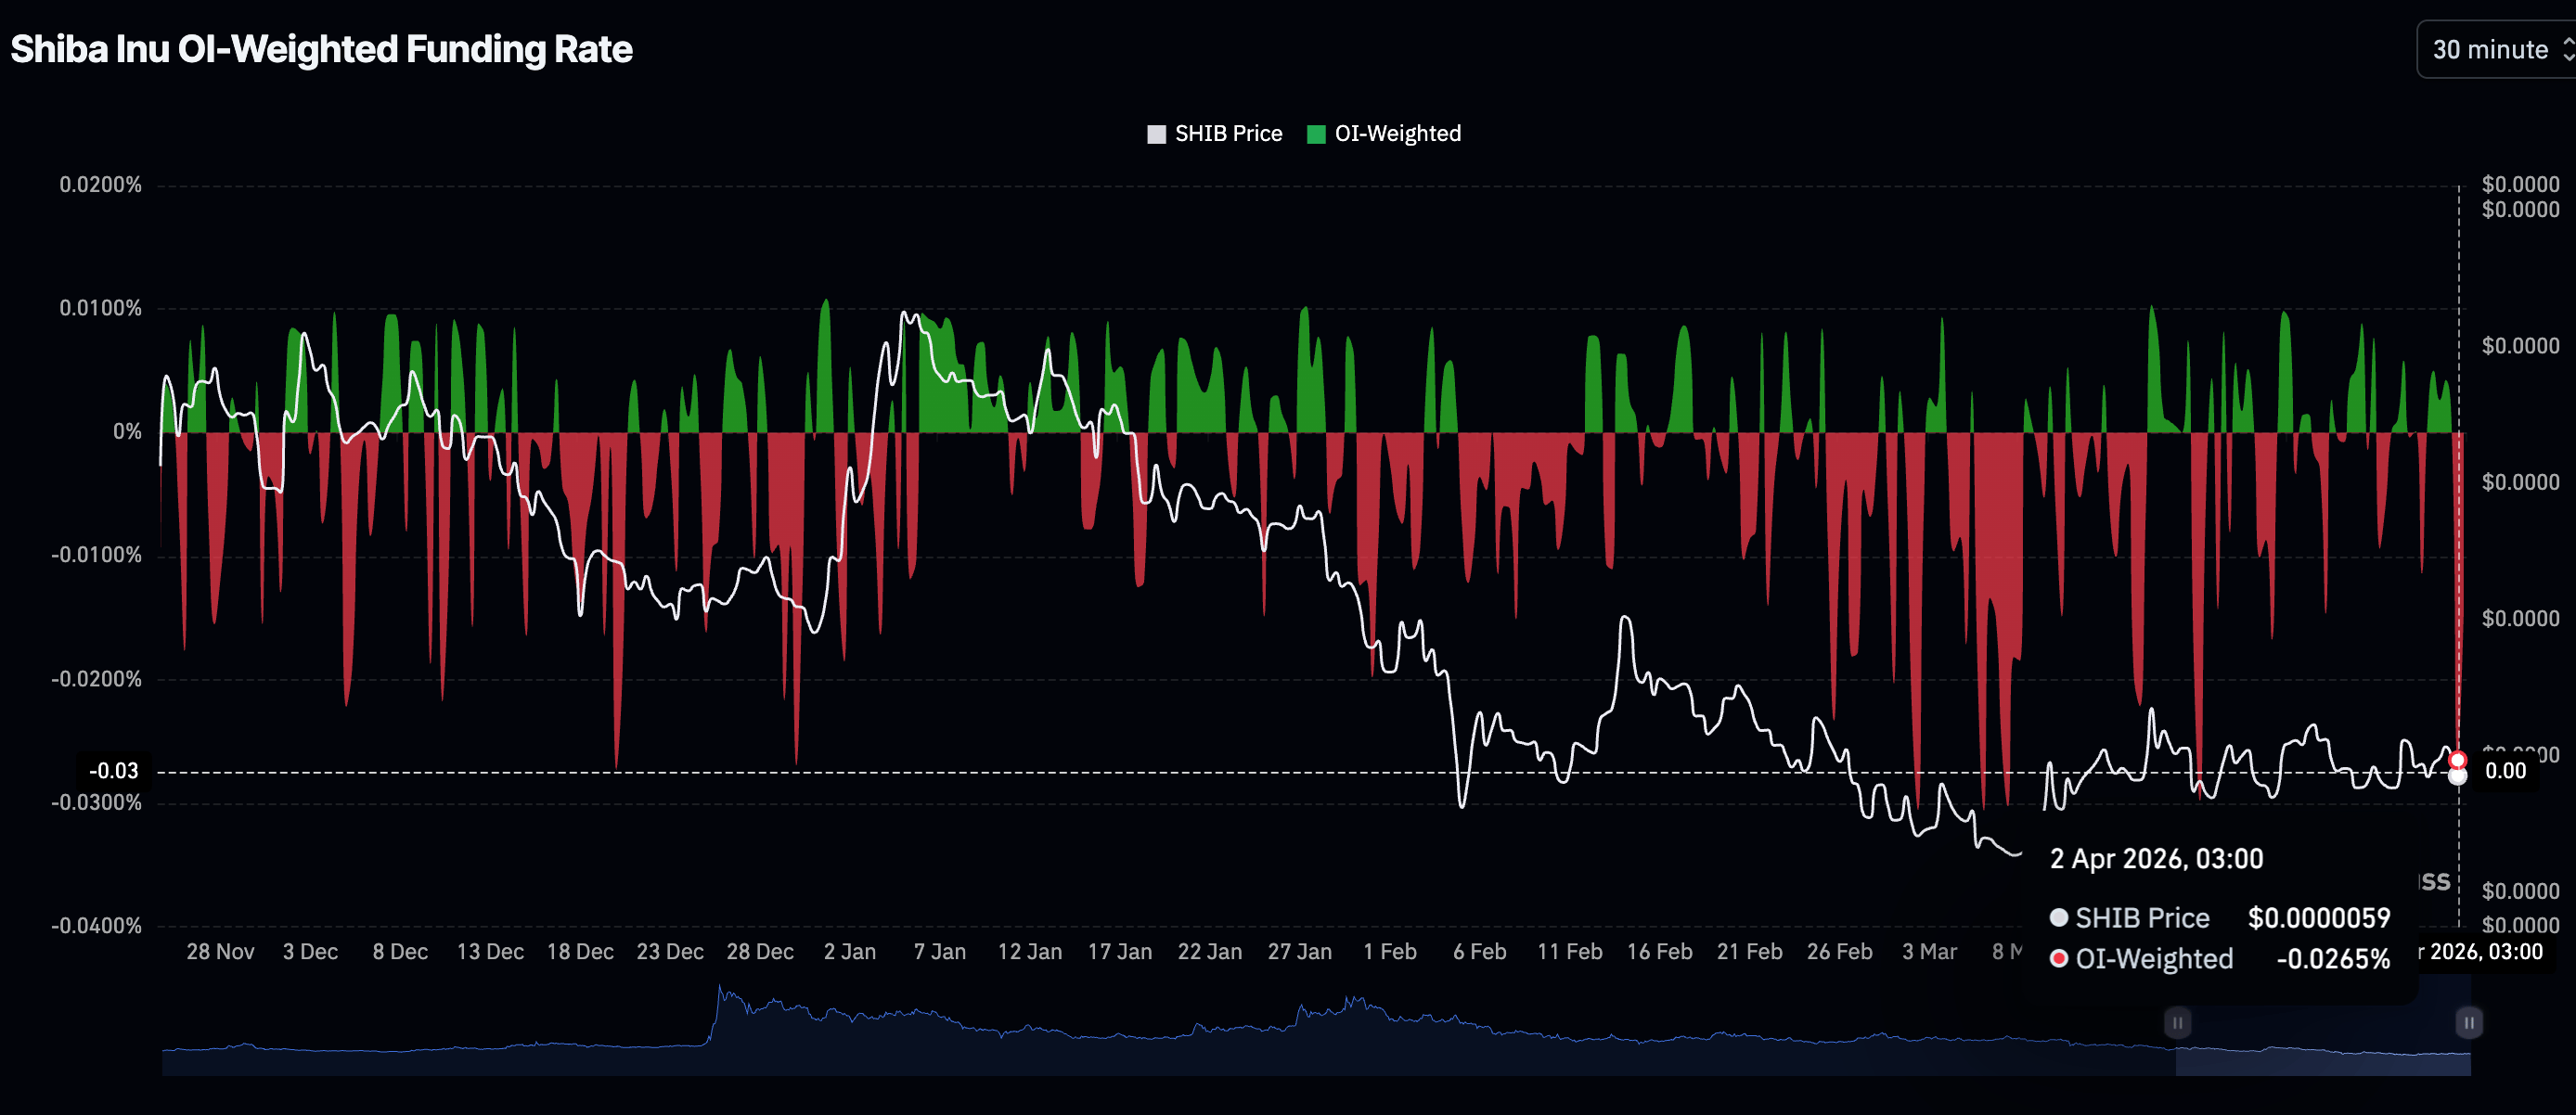
On the flip side, if the funding rate remains negative for extended periods and the price consolidates above a key support level, a short squeeze setup could come into play, potentially triggering a knee-jerk recovery.
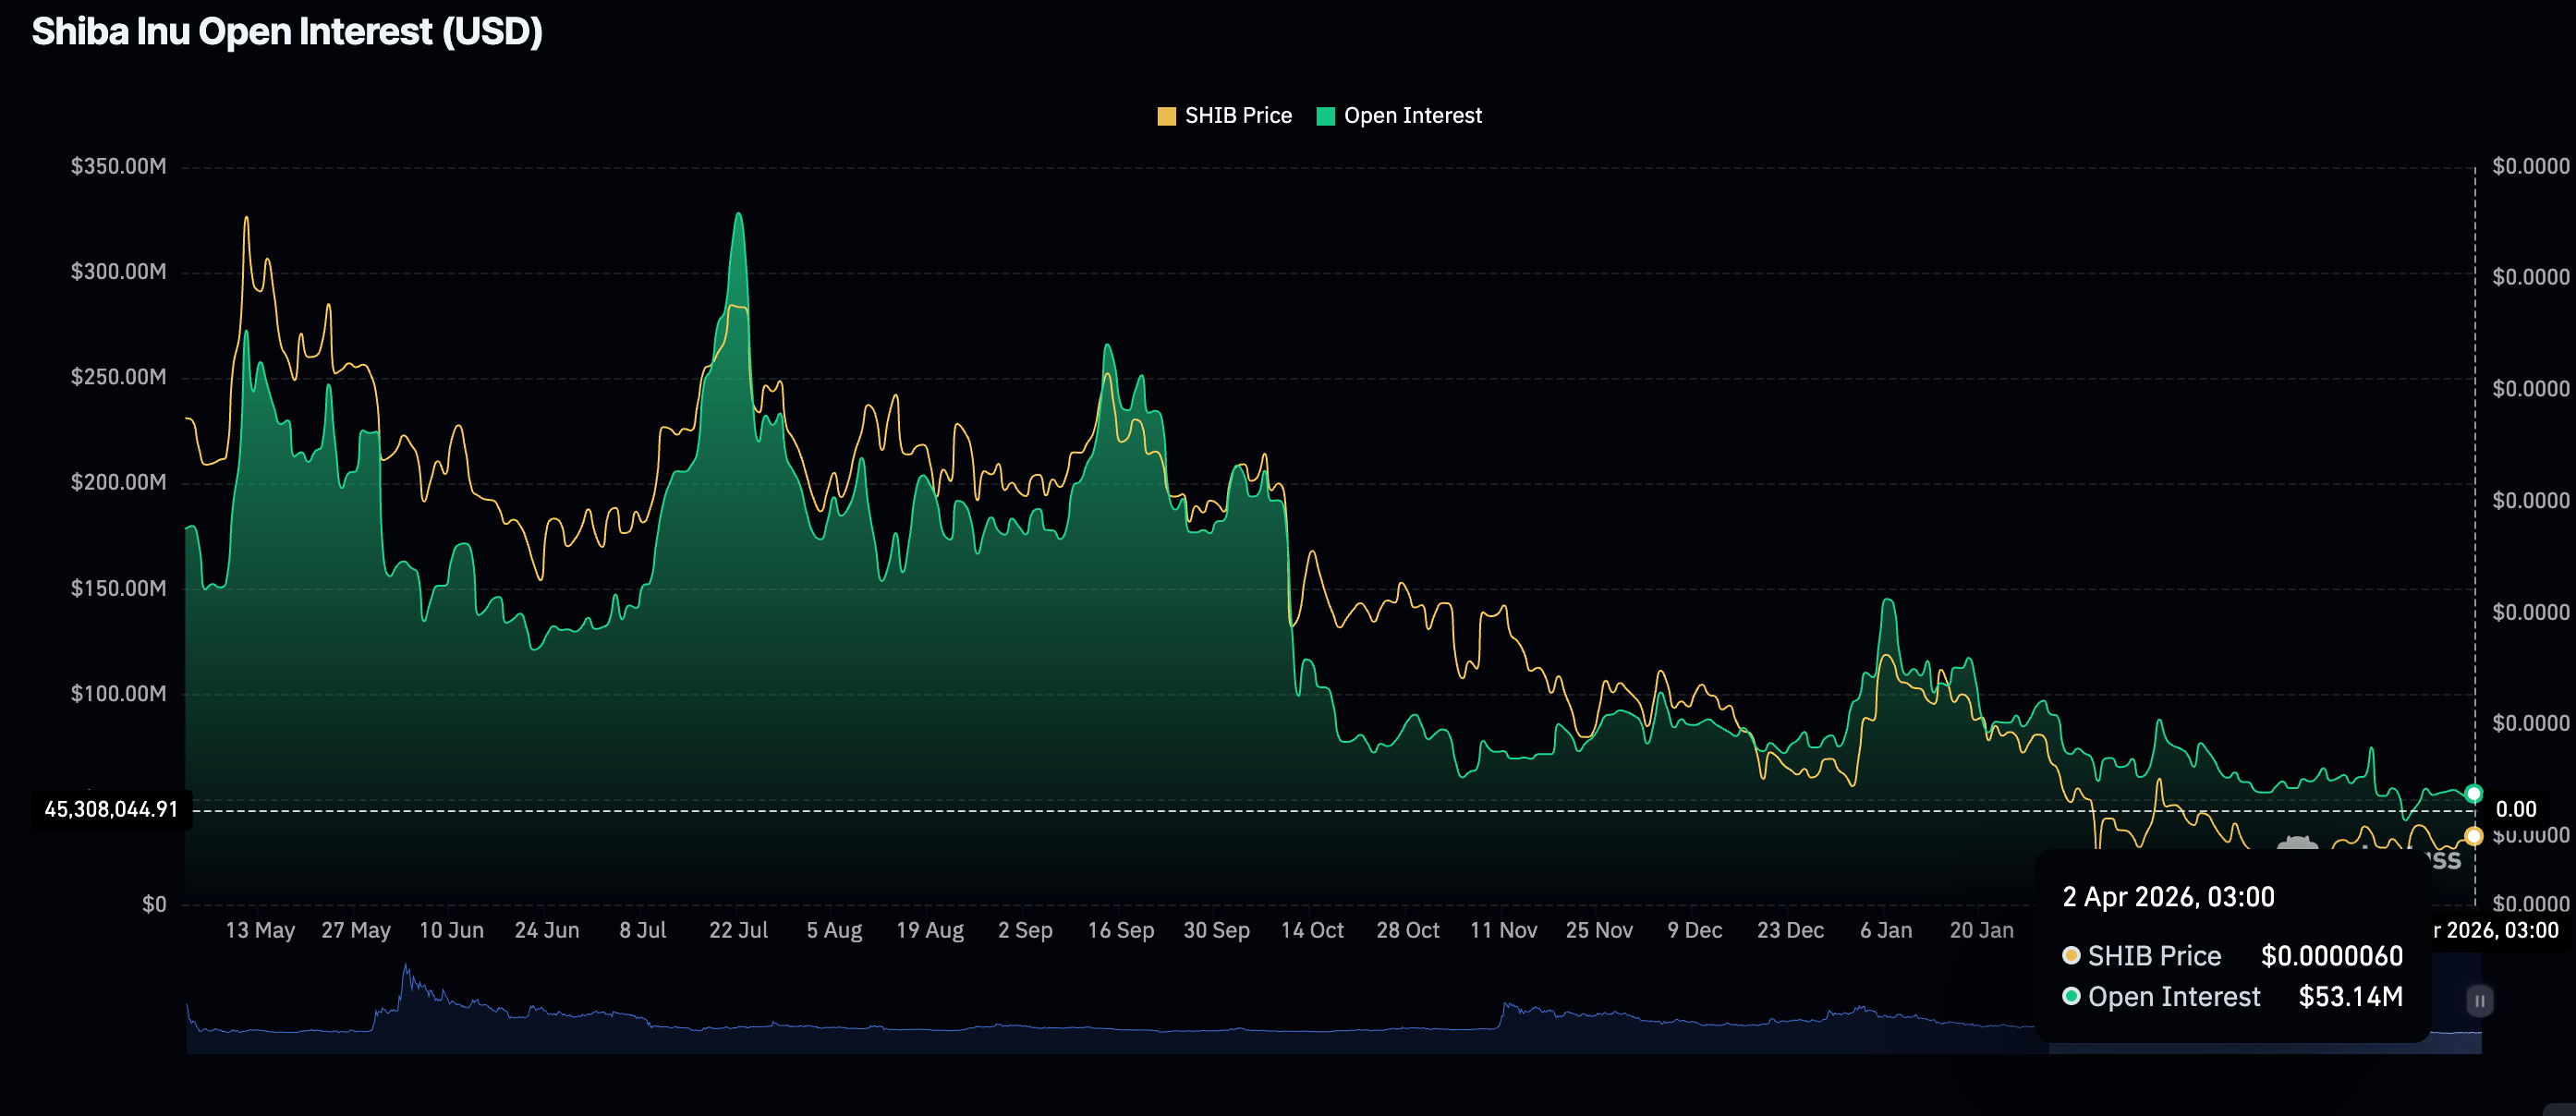
2. Shiba Inu retail demand cools
Shiba Inu experiences cooling retail demand, with OI, reflecting the notional value of outstanding futures and options contracts, steadying at $52 billion on Thursday. The futures OI remains significantly below the record $328 million reached in July, when the price rallied to $0.0000155. If retail demand fails to recover, SHIB will lack the required buying pressure to sustain an uptrend, keeping the overall trend bearish.
Technical outlook: Shiba Inu sellers tighten their grip
Shiba Inu is trading around $0.0000058 amid a neutral-to-bearish outlook. The price holds below the descending 50-day, 100-day and 200-day Exponential Moving Averages (EMAs), clustered between $0.0000061 and $0.0000082.
At the same time, the descending trendline defines SHIB’s overall downward trend. A break above this line may ease overhead pressure and increase the chances of a breakout above the 50-day EMA.
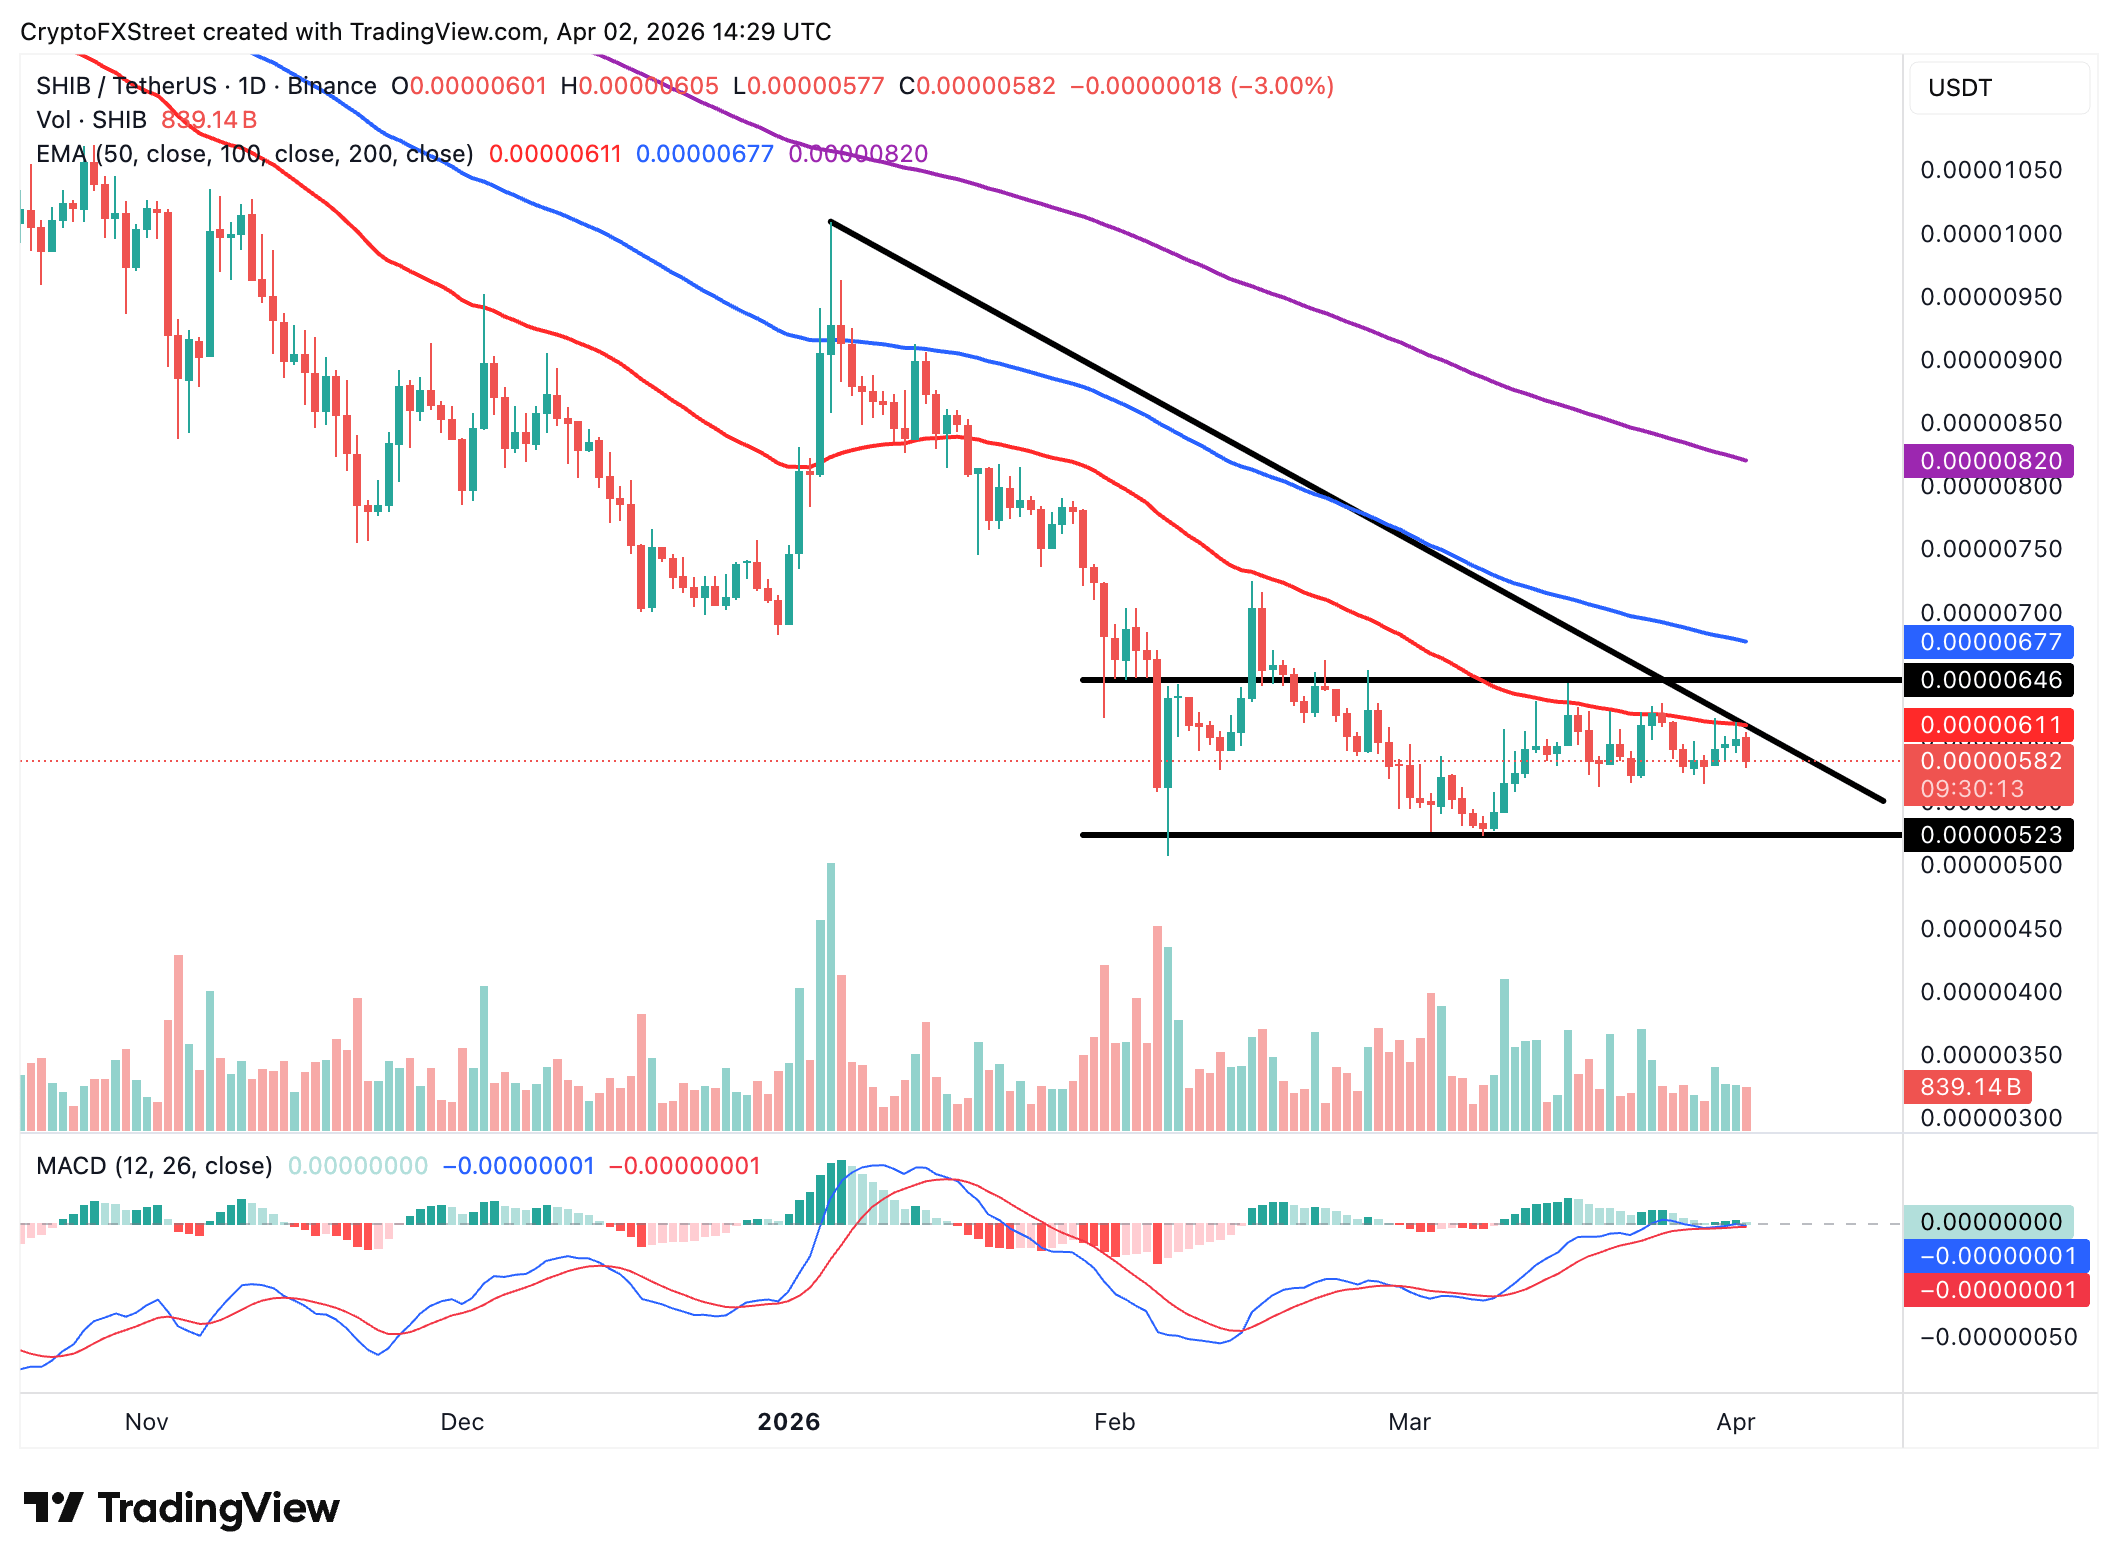
The Moving Average Convergence Divergence (MACD) indicator holds slightly above its signal line on the daily chart, suggesting that bulls still have the potential to regain control. A decisive break above the trendline barrier and the 50-day EMA would open the path to higher targets such as the 100-day EMA at $0.0000068 and the 200-day EMA at $0.0000082.
Open Interest, funding rate FAQs
Higher Open Interest is associated with higher liquidity and new capital inflow to the market. This is considered the equivalent of increase in efficiency and the ongoing trend continues. When Open Interest decreases, it is considered a sign of liquidation in the market, investors are leaving and the overall demand for an asset is on a decline, fueling a bearish sentiment among investors.
Funding fees bridge the difference between spot prices and prices of futures contracts of an asset by increasing liquidation risks faced by traders. A consistently high and positive funding rate implies there is a bullish sentiment among market participants and there is an expectation of a price hike. A consistently negative funding rate for an asset implies a bearish sentiment, indicating that traders expect the cryptocurrency’s price to fall and a bearish trend reversal is likely to occur.

Über eine Million Nutzer verlassen sich auf FXStreet für Echtzeit-Marktdaten, Charting-Tools, Experteneinblicke und Forex-News. Der umfassende Wirtschaftskalender und die Bildungs-Webinare helfen Tradern, informiert zu bleiben und fundierte Entscheidungen zu treffen. FXStreet wird von einem Team von rund 60 Fachleuten getragen, verteilt auf den Hauptsitz in Barcelona und verschiedene Regionen weltweit.
Weiterlesen


