
USD/CAD Price Forecast: At an important support area around 1.3820
Von Guillermo Alcala
Veröffentlichungsdatum: 8 Dec 2025 | Änderungsdatum: 8 Dec 2025


BELIEBTE ARTIKEL

The US Dollar remains in a strongly bearish trend against the Canadian Dollar. The pair lost nearly 2% in the last two weeks, and upside attempts remain limited.
- The US Dollar might find support at the 1.3820 area on its sell-off against the CAD.
- A "hawkish cut" by the Fed on Wednesday might help the USD to regain lost ground.
- The USD/CAD has reached the target of November's Double top pattern.
The US Dollar remains in a strongly bearish trend against the Canadian Dollar. The pair lost nearly 2% in the last two weeks, and upside attempts remain limited. Nevertheless, price action has reached a key area, at 1.3820, where the pair might find some support.
The fundamental context is negative, with the Fed likely to cut rates on Wednesday, and the BoC expected to keep its monetary policy unchanged. That said, the Fed’s move has been poaractically discounted already, and a likely hawkish message from Fed Chairman Jerome Powell might provide some support to an ailing Greenback.
Technical analysis: USD/CAD has reached the Double Top’s target
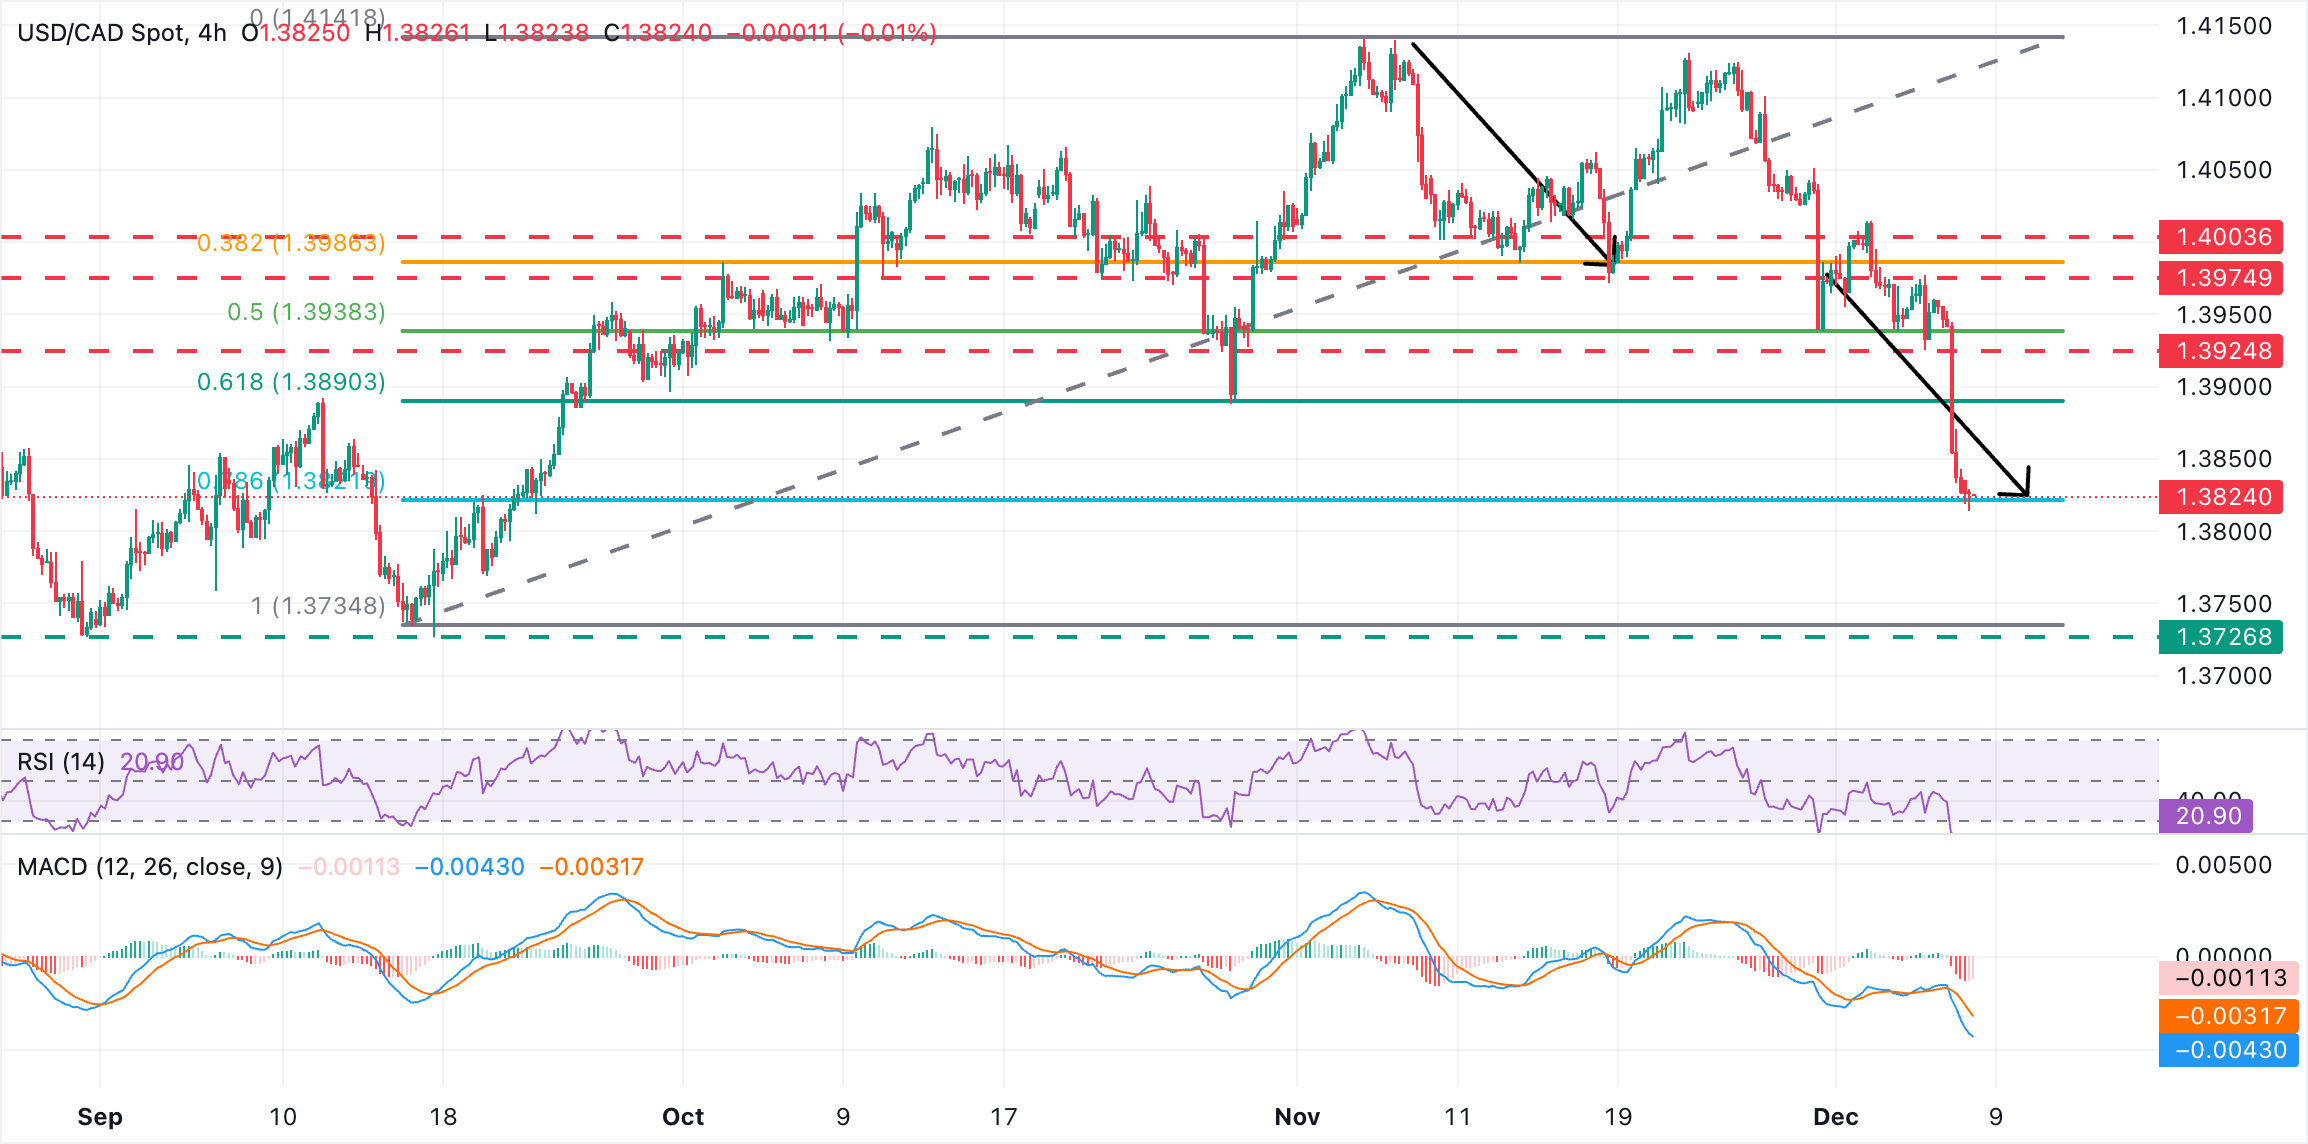
The pair has reached a key support area where the measured target of November’s Double Top –in the area of 1.1430-1.1440–, meets the 78.2% Fibonacci retracement of the September - November rally, a common target for corrections, which lies at 1.3818.
The pair, however, is not showing any sign of a potential trend shift as of yet. The 4-hour Relative Strength Index (RSI) has reached oversold levels, but upside attempts remain muted so far. The Moving Average Convergence Divergence reveals a strong negative momentum.
Below the mentioned 1.3830 support, the next target is the August and September trough, at 1.3715. Further down, the late July low at the 1.3570 area would come next. Resistances are at the previous support of 1.3925 (December 4 low), ahead of the December 4 high near 1.3975 and the 1.4000 psychological level.
US Dollar Price Today
The table below shows the percentage change of US Dollar (USD) against listed major currencies today. US Dollar was the strongest against the British Pound.
| USD | EUR | GBP | JPY | CAD | AUD | NZD | CHF | |
|---|---|---|---|---|---|---|---|---|
| USD | -0.14% | 0.00% | -0.02% | -0.08% | -0.01% | -0.11% | -0.11% | |
| EUR | 0.14% | 0.15% | 0.11% | 0.06% | 0.14% | 0.03% | 0.04% | |
| GBP | -0.01% | -0.15% | -0.02% | -0.09% | -0.02% | -0.12% | -0.11% | |
| JPY | 0.02% | -0.11% | 0.02% | -0.06% | -0.00% | -0.10% | -0.10% | |
| CAD | 0.08% | -0.06% | 0.09% | 0.06% | 0.07% | -0.04% | -0.02% | |
| AUD | 0.01% | -0.14% | 0.02% | 0.00% | -0.07% | -0.11% | -0.10% | |
| NZD | 0.11% | -0.03% | 0.12% | 0.10% | 0.04% | 0.11% | 0.00% | |
| CHF | 0.11% | -0.04% | 0.11% | 0.10% | 0.02% | 0.10% | -0.01% |
The heat map shows percentage changes of major currencies against each other. The base currency is picked from the left column, while the quote currency is picked from the top row. For example, if you pick the US Dollar from the left column and move along the horizontal line to the Japanese Yen, the percentage change displayed in the box will represent USD (base)/JPY (quote).

Über eine Million Nutzer verlassen sich auf FXStreet für Echtzeit-Marktdaten, Charting-Tools, Experteneinblicke und Forex-News. Der umfassende Wirtschaftskalender und die Bildungs-Webinare helfen Tradern, informiert zu bleiben und fundierte Entscheidungen zu treffen. FXStreet wird von einem Team von rund 60 Fachleuten getragen, verteilt auf den Hauptsitz in Barcelona und verschiedene Regionen weltweit.
Weiterlesen


