
USD/JPY Price Forecast: Continues to hold 20-day EMA amid fears of Middle East war escalation
Von Sagar Dua
Aktualisiert: 6 Apr 2026


BELIEBTE ARTIKEL

The USD/JPY pair trades marginally down at around 159.55 during the Asian trading session on Monday.
- USD/JPY edges down to near 159.55 as the US Dollar ticks lower.
- US President Trump promises an assault on Iran if it doesn’t reopen the Strait of Hormuz.
- Investors await the US ISM Services PMI data for March.
The USD/JPY pair trades marginally down at around 159.55 during the Asian trading session on Monday. The pair shows a subdued performance as the US Dollar (USD) ticks lower, while broadly remaining firm due to threats from United States (US) President Donald Trump that he will destroy Iranian infrastructure if it doesn’t agree to a deal.
During the press time, the US Dollar Index (DXY), which tracks the Greenback’s value against six major currencies, trades marginally lower to near 100.15.
Over the weekend, US President Trump promised “hell” for Iran’s power plants and bridges, through a post on Truth.Social, if Tehran doesn’t reopen the Strait of Hormuz before the deadline, which is Tuesday, April 7, at 9:00 PM Eastern time.
On the macro front, investors await the US ISM Services PMI data for March, which will be released at 14:00 GMT. The Services PMI is expected to arrive lower at 55.0 from 56.1 in February.
Meanwhile, fears of escalating Middle East war have also improved the safe-haven demand of the Japanese Yen (JPY).
USD/JPY technical analysis
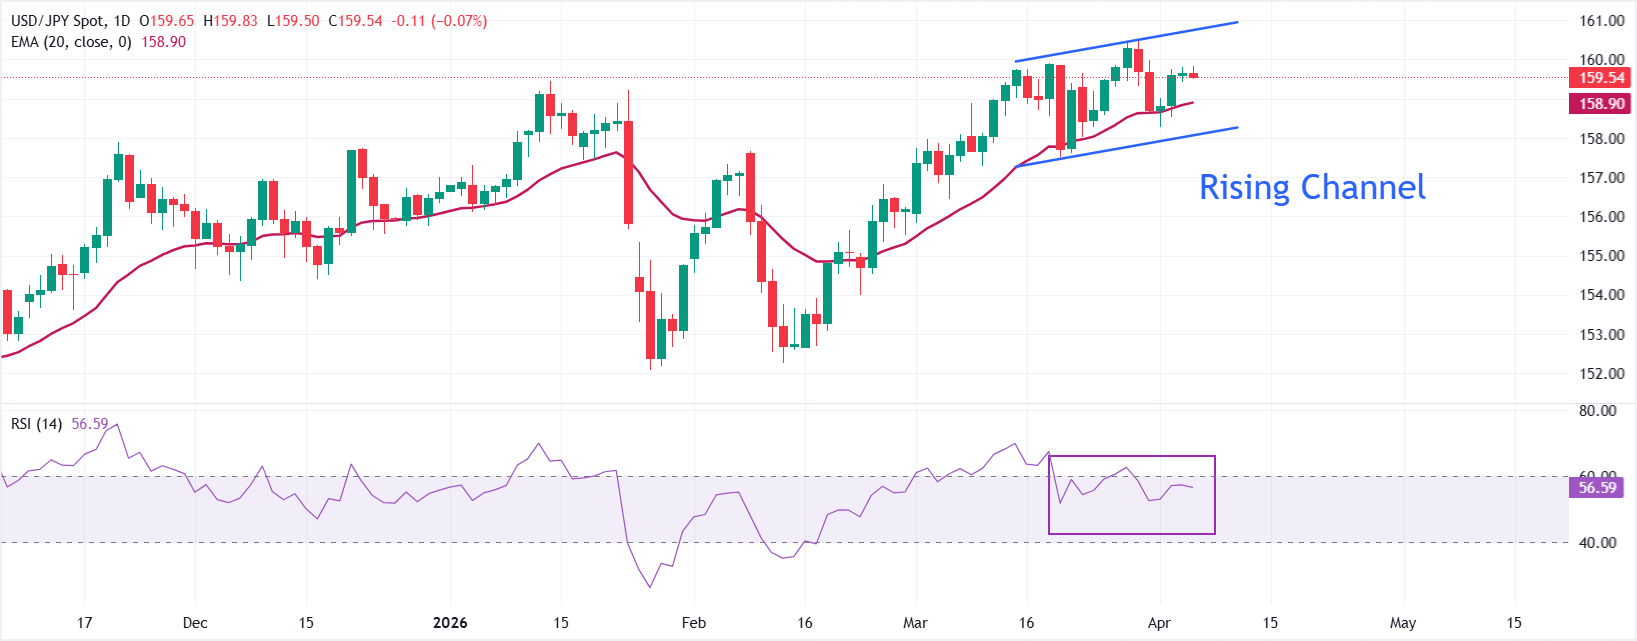
USD/JPY ticks lower at around 159.55 as of writing. However, the near-term bias is bullish as price holds within an ascending channel and consolidates beneath the upper boundary. The pair trades above the 20-day exponential moving average around 158.90, which underpins the advance and aligns with the pattern of higher lows along the channel floor near 158.10.
The 14-day Relative Strength Index (RSI) has shifted into the 40.00-60.00 zone, indicating positive, though not extreme, momentum that supports ongoing upside pressure while the channel structure is respected.
Initial resistance emerges at 160.45, the recent swing high, with the channel top near 161.00 as the next barrier to extended gains. A clear break above the latter would open the way toward higher psychological levels beyond 162.00. On the downside, immediate support is seen at the 20-day EMA near 158.90, ahead of the channel base around 158.10, which defines the lower boundary of the current uptrend. A daily close below 158.10 would weaken the bullish structure and expose deeper retracement levels toward the mid-157.00s.
(The technical analysis of this story was written with the help of an AI tool.)
US Dollar FAQs
The US Dollar (USD) is the official currency of the United States of America, and the ‘de facto’ currency of a significant number of other countries where it is found in circulation alongside local notes. It is the most heavily traded currency in the world, accounting for over 88% of all global foreign exchange turnover, or an average of $6.6 trillion in transactions per day, according to data from 2022. Following the second world war, the USD took over from the British Pound as the world’s reserve currency. For most of its history, the US Dollar was backed by Gold, until the Bretton Woods Agreement in 1971 when the Gold Standard went away.
The most important single factor impacting on the value of the US Dollar is monetary policy, which is shaped by the Federal Reserve (Fed). The Fed has two mandates: to achieve price stability (control inflation) and foster full employment. Its primary tool to achieve these two goals is by adjusting interest rates. When prices are rising too quickly and inflation is above the Fed’s 2% target, the Fed will raise rates, which helps the USD value. When inflation falls below 2% or the Unemployment Rate is too high, the Fed may lower interest rates, which weighs on the Greenback.
In extreme situations, the Federal Reserve can also print more Dollars and enact quantitative easing (QE). QE is the process by which the Fed substantially increases the flow of credit in a stuck financial system. It is a non-standard policy measure used when credit has dried up because banks will not lend to each other (out of the fear of counterparty default). It is a last resort when simply lowering interest rates is unlikely to achieve the necessary result. It was the Fed’s weapon of choice to combat the credit crunch that occurred during the Great Financial Crisis in 2008. It involves the Fed printing more Dollars and using them to buy US government bonds predominantly from financial institutions. QE usually leads to a weaker US Dollar.
Quantitative tightening (QT) is the reverse process whereby the Federal Reserve stops buying bonds from financial institutions and does not reinvest the principal from the bonds it holds maturing in new purchases. It is usually positive for the US Dollar.

Über eine Million Nutzer verlassen sich auf FXStreet für Echtzeit-Marktdaten, Charting-Tools, Experteneinblicke und Forex-News. Der umfassende Wirtschaftskalender und die Bildungs-Webinare helfen Tradern, informiert zu bleiben und fundierte Entscheidungen zu treffen. FXStreet wird von einem Team von rund 60 Fachleuten getragen, verteilt auf den Hauptsitz in Barcelona und verschiedene Regionen weltweit.
Weiterlesen


