
XAG/USD surges above $90 as tariff fears temper and supply deficit fuels rally
Von Joshua Gibson
Veröffentlichungsdatum: 26 Feb 2026 | Änderungsdatum: 26 Feb 2026


BELIEBTE ARTIKEL

XAG/USD surged about 4% on Wednesday, rallying sharply to close near $91 in a session driven by renewed safe-haven demand. The pair has been recovering from its late-January crash, when price collapsed from all-time highs above $121 to a low around $64 in early February, a drop of roughly 47%.
- Spot Silver jumped 4% on safe-haven demand amid Trump's global tariffs.
- The global Silver market is on track for a sixth straight annual supply deficit in 2026, with demand outpacing supply by an estimated 67 to 200 million ounces while mine output stays flat.
- The Federal Reserve is holding rates at 3.50% to 3.75%, with January FOMC minutes showing several officials discussed the possibility of rate hikes if inflation stays above target.
XAG/USD surged about 4% on Wednesday, rallying sharply to close near $91 in a session driven by renewed safe-haven demand. The pair has been recovering from its late-January crash, when price collapsed from all-time highs above $121 to a low around $64 in early February, a drop of roughly 47%. Since bottoming, Silver has built a basing pattern with a series of higher lows between about $76 and $90 over the past three weeks, and Tuesday's strong bullish candle pushed price back above the $90 round number for the first time since the sell-off.
President Trump's 15% global tariff announcement following the Supreme Court ruling against his earlier trade measures sent a fresh wave of safe-haven buying into precious metals. Silver's dual identity as both a monetary hedge and an industrial metal has amplified the move, with COMEX registered inventories sitting at all-time lows below 100 million ounces and physical supply in London still tight. The structural deficit is being driven by record demand from solar panel manufacturers, AI data centres, and electric vehicle production, while mine output is holding around 820 million ounces with limited room to scale.
On the US Dollar side, the Federal Reserve (Fed) held rates at 3.50% to 3.75% in January, but the minutes released last week showed several participants discussed the possibility of raising rates if inflation stays above target. Fed Chair Jerome Powell's term expires in May 2026, and the incoming chair is widely expected to adopt a more dovish stance, which could provide an additional tailwind for non-yielding metals later in the year.
Recovery above $90 as oscillators hint at overbought conditions
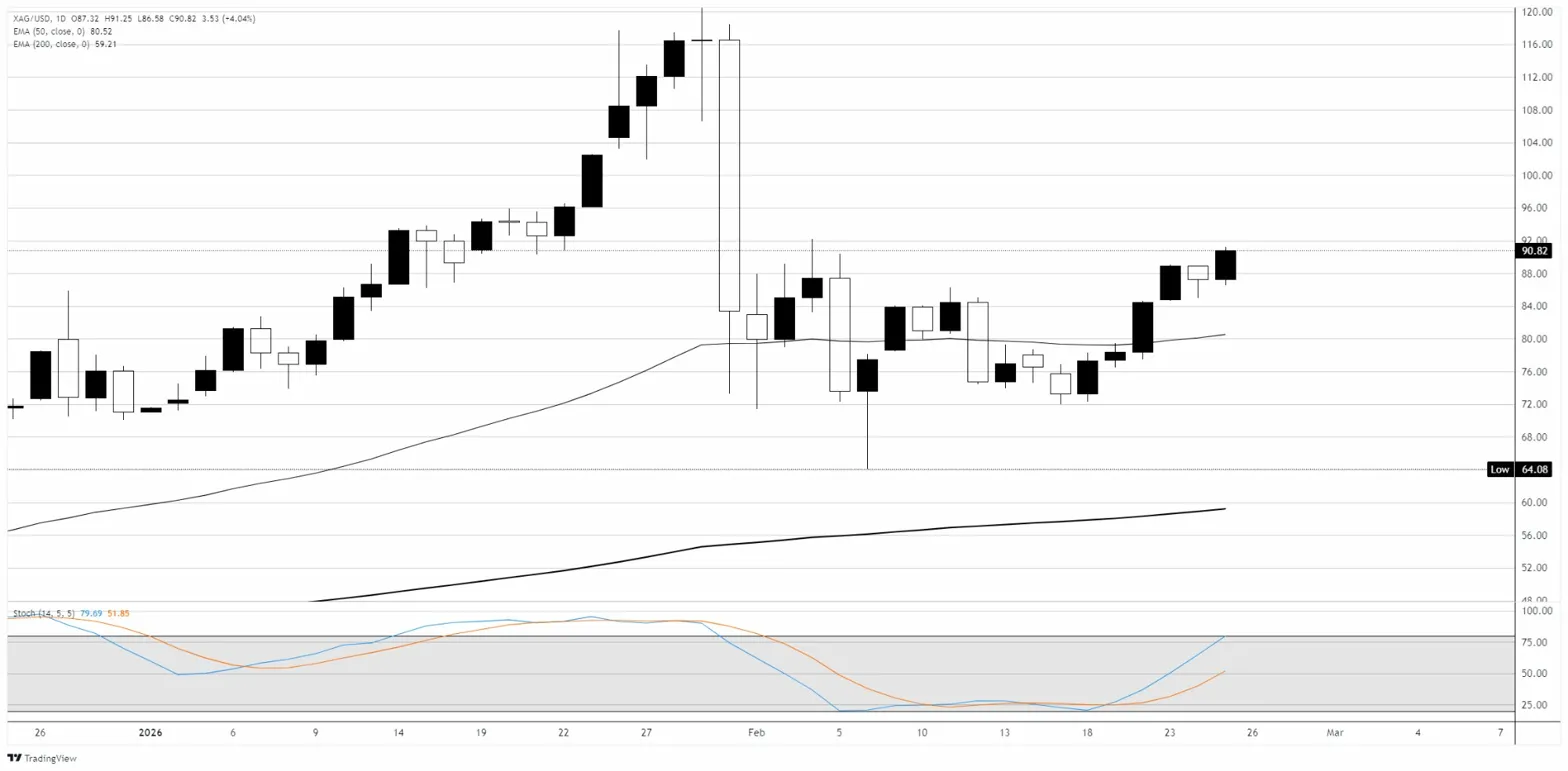
Price is holding well above the rising 50-day Exponential Moving Average (EMA) close to $81 and the 200-day EMA around $59, with both averages still trending higher and confirming the broader bull trend that has been in place since late 2024. The sharp recovery from the early-February low near $64 has retraced roughly half of the January sell-off, with price now trading above the $90 level. The Stochastic Oscillator has crossed bullish and is rising through neutral territory toward the overbought zone, suggesting upside momentum is rebuilding. A sustained push above the $92 area would open a path toward the $96 to $100 zone, while a failure to hold above $87 would shift focus back toward the 50-day EMA.
XAG/USD daily chart
(This story was corrected on February 25th to say Wednesday, not Tuesday)
Silver FAQs
Silver is a precious metal highly traded among investors. It has been historically used as a store of value and a medium of exchange. Although less popular than Gold, traders may turn to Silver to diversify their investment portfolio, for its intrinsic value or as a potential hedge during high-inflation periods. Investors can buy physical Silver, in coins or in bars, or trade it through vehicles such as Exchange Traded Funds, which track its price on international markets.
Silver prices can move due to a wide range of factors. Geopolitical instability or fears of a deep recession can make Silver price escalate due to its safe-haven status, although to a lesser extent than Gold's. As a yieldless asset, Silver tends to rise with lower interest rates. Its moves also depend on how the US Dollar (USD) behaves as the asset is priced in dollars (XAG/USD). A strong Dollar tends to keep the price of Silver at bay, whereas a weaker Dollar is likely to propel prices up. Other factors such as investment demand, mining supply – Silver is much more abundant than Gold – and recycling rates can also affect prices.
Silver is widely used in industry, particularly in sectors such as electronics or solar energy, as it has one of the highest electric conductivity of all metals – more than Copper and Gold. A surge in demand can increase prices, while a decline tends to lower them. Dynamics in the US, Chinese and Indian economies can also contribute to price swings: for the US and particularly China, their big industrial sectors use Silver in various processes; in India, consumers’ demand for the precious metal for jewellery also plays a key role in setting prices.
Silver prices tend to follow Gold's moves. When Gold prices rise, Silver typically follows suit, as their status as safe-haven assets is similar. The Gold/Silver ratio, which shows the number of ounces of Silver needed to equal the value of one ounce of Gold, may help to determine the relative valuation between both metals. Some investors may consider a high ratio as an indicator that Silver is undervalued, or Gold is overvalued. On the contrary, a low ratio might suggest that Gold is undervalued relative to Silver.

Über eine Million Nutzer verlassen sich auf FXStreet für Echtzeit-Marktdaten, Charting-Tools, Experteneinblicke und Forex-News. Der umfassende Wirtschaftskalender und die Bildungs-Webinare helfen Tradern, informiert zu bleiben und fundierte Entscheidungen zu treffen. FXStreet wird von einem Team von rund 60 Fachleuten getragen, verteilt auf den Hauptsitz in Barcelona und verschiedene Regionen weltweit.
Weiterlesen


