
Trade The World
Bitcoin Cash Price Forecast: BCH targets $640 amid bullish reversal, Open Interest surge
Von Vishal Dixit
Veröffentlichungsdatum: 2 Sep 2025 | Änderungsdatum: 2 Sep 2025


POPULAR ARTICLES

Bitcoin Cash (BCH) edges higher by 3% at press time on Tuesday, reclaiming the 50-day Exponential Moving Average at $548. The rebound aligns with renewed interest from the derivatives market, as the technical outlook remains bullish.
- Bitcoin Cash rebounds on Monday from a crucial support level, hinting at a potential reversal.
- The technical indicators suggest a potential reversal rally ahead.
- BCH Open Interest jumps nearly 10% in the last 24 hours, signaling increased trader appeal.
Bitcoin Cash (BCH) edges higher by 3% at press time on Tuesday, reclaiming the 50-day Exponential Moving Average at $548. The rebound aligns with renewed interest from the derivatives market, as the technical outlook remains bullish.
Renewed interest in BCH boosts Open Interest
CoinGlass data indicates that the BCH Open Interest (OI) has increased by nearly 10% over the last 24 hours, reaching $563.74 million. Typically, an increase in interest among traders leads to heightened capital inflows in BCH derivatives, fueling the rise in OI.
Adding to the increased optimism, the OI-weighted funding rate of 0.0086% sustains at elevated levels, signaling a buy-side dominance in trading activity. This is based on the logic that bulls pay positive funding rates as a premium to maintain a balance between swap and spot prices amid heightened buying activities.
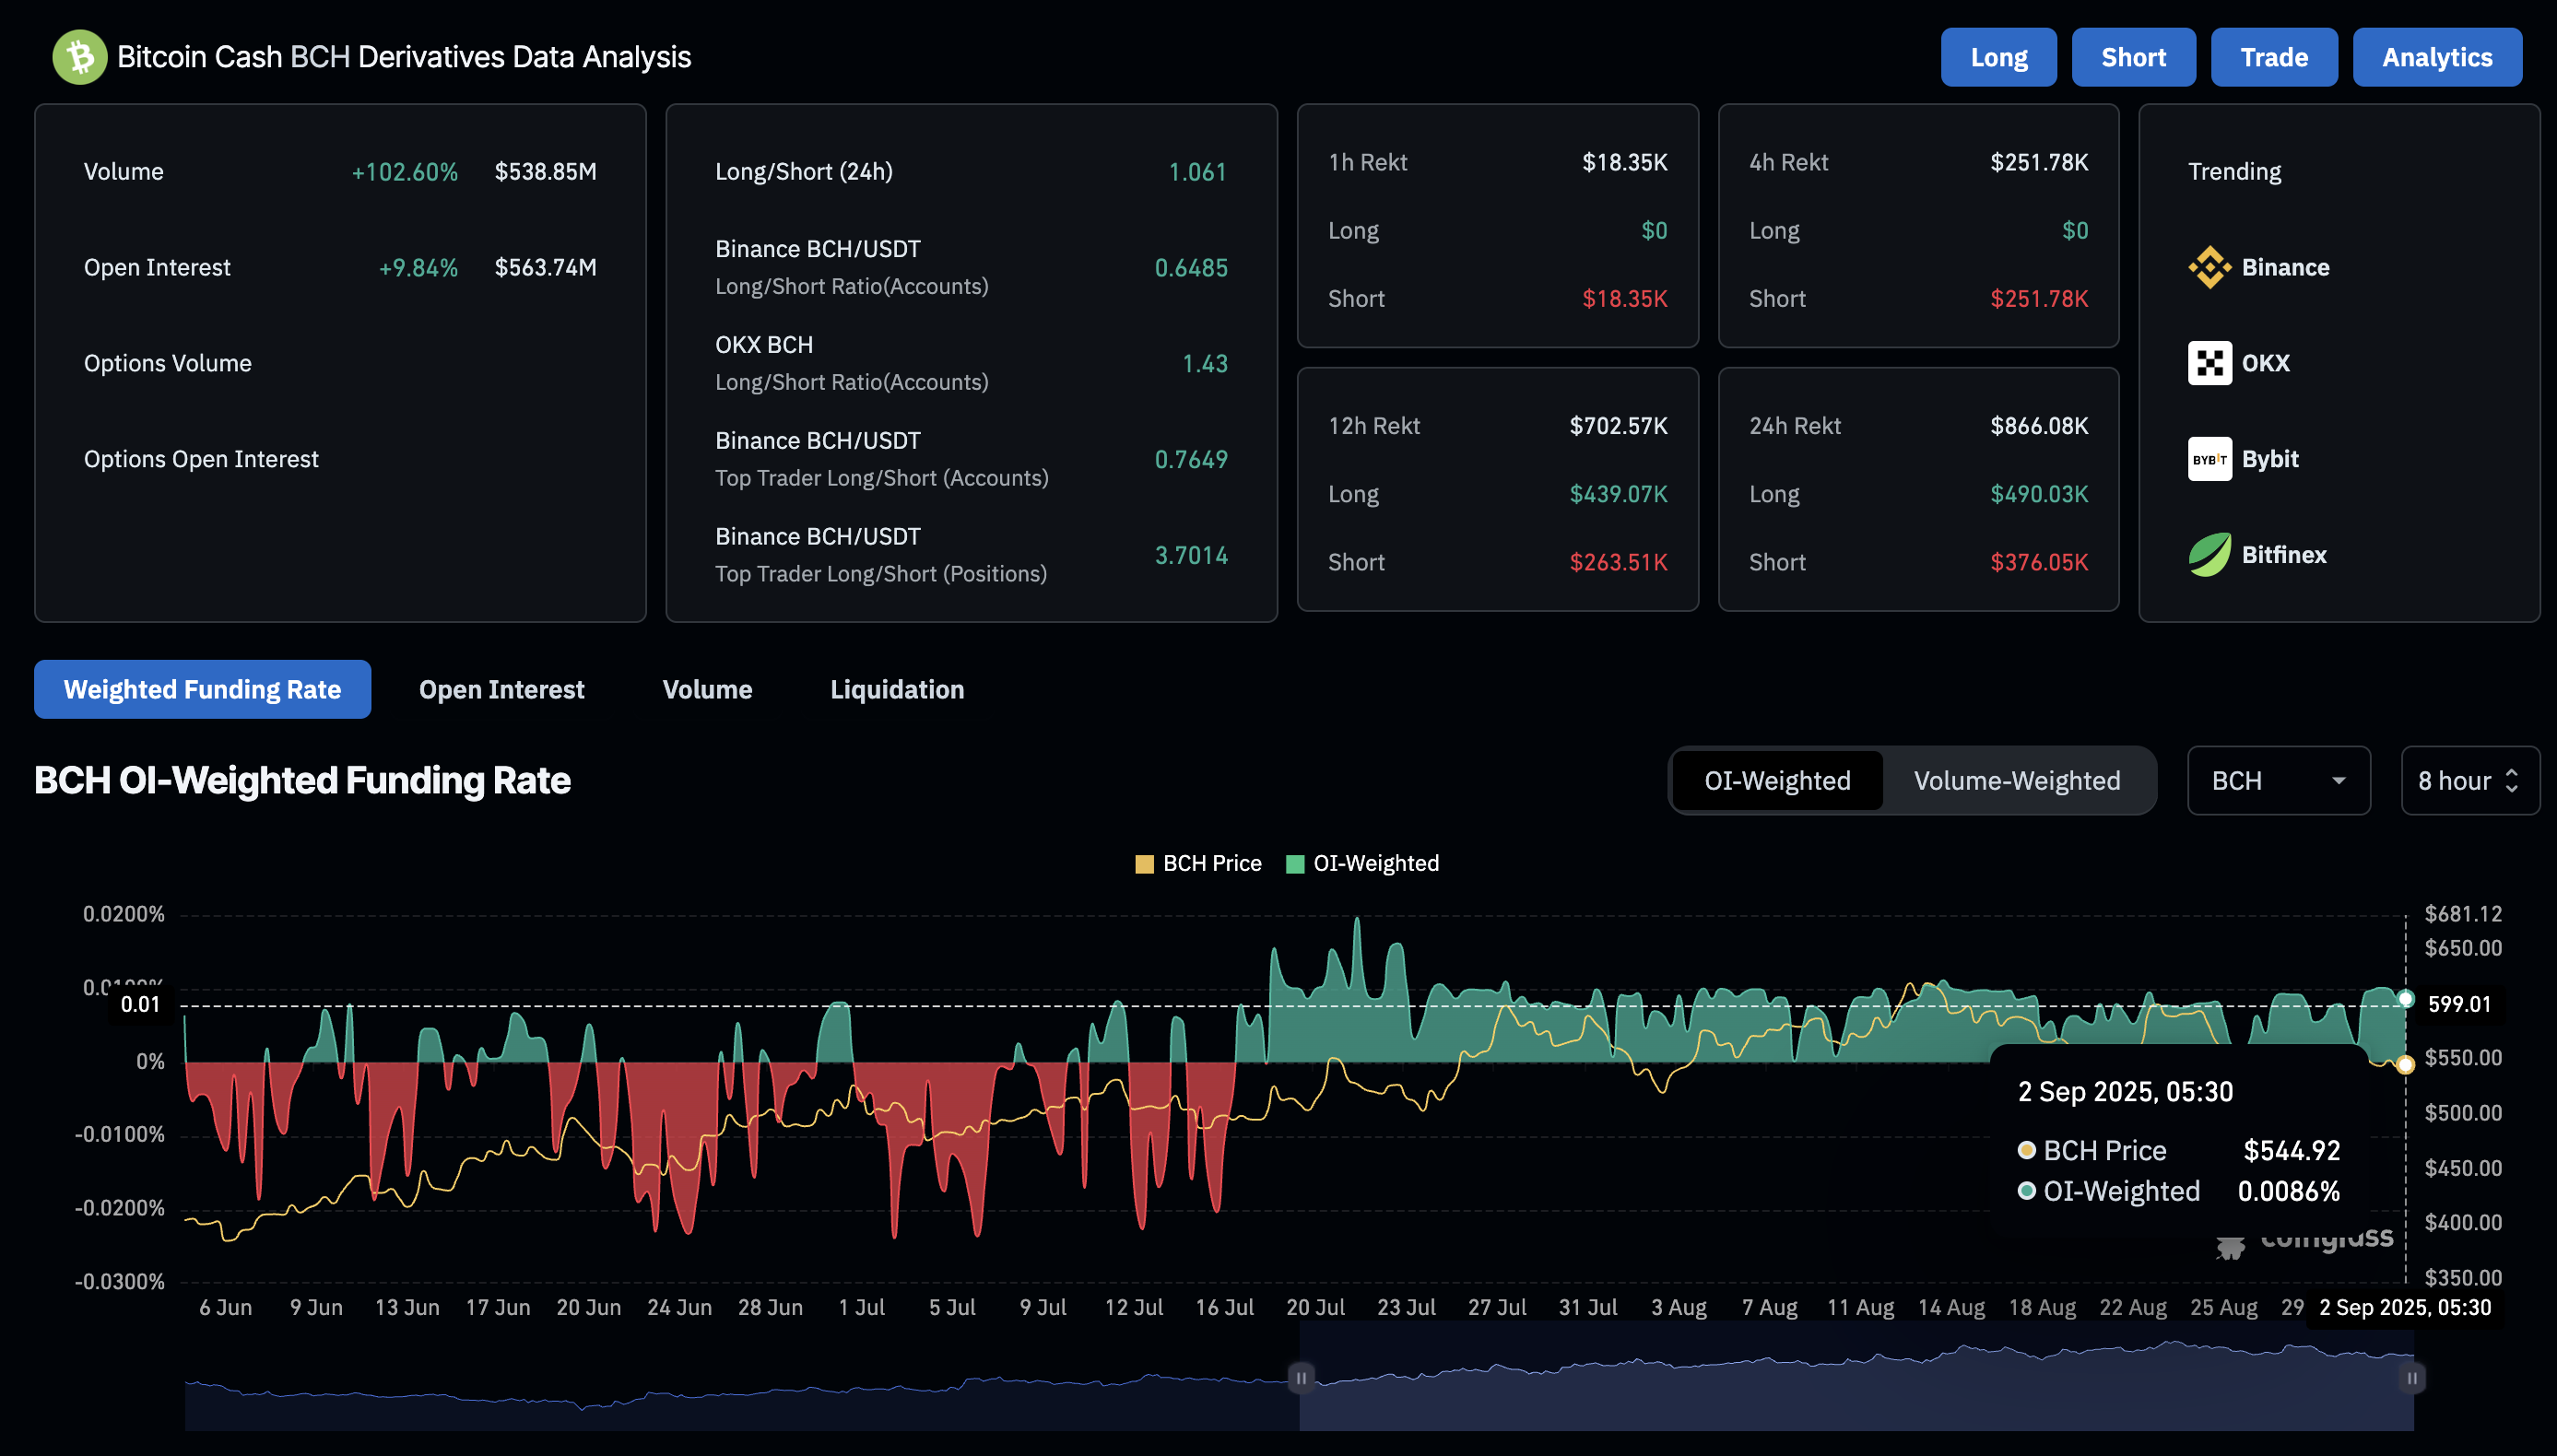
BCH derivatives. Source: Coinglass
Bitcoin Cash on a rebound journey targets $640
Bitcoin Cash ticks higher on Tuesday following a Doji candle formation on Monday, extending the bounce back from the 78.6% Fibonacci level at $523, which is drawn from the $640 peak from December 6 to the $249 low from April 7.
The bounce back reclaims the 50-day EMA at $548 and targets the $640 peak.
The momentum indicators on the daily chart suggest a shift in trend dynamics as Bitcoin Cash reverses, with the Relative Strength Index (RSI) rising to 52, crossing above the halfway line. This upward movement in RSI indicates increased buying pressure with room for growth before reaching overbought levels.
Additionally, the Moving Average Convergence Divergence (MACD) is on an upward-sloping trend, ready to converge with its signal line, which would signal a potential trend reversal. A potential crossover could be considered a buy signal by sidelined investors.
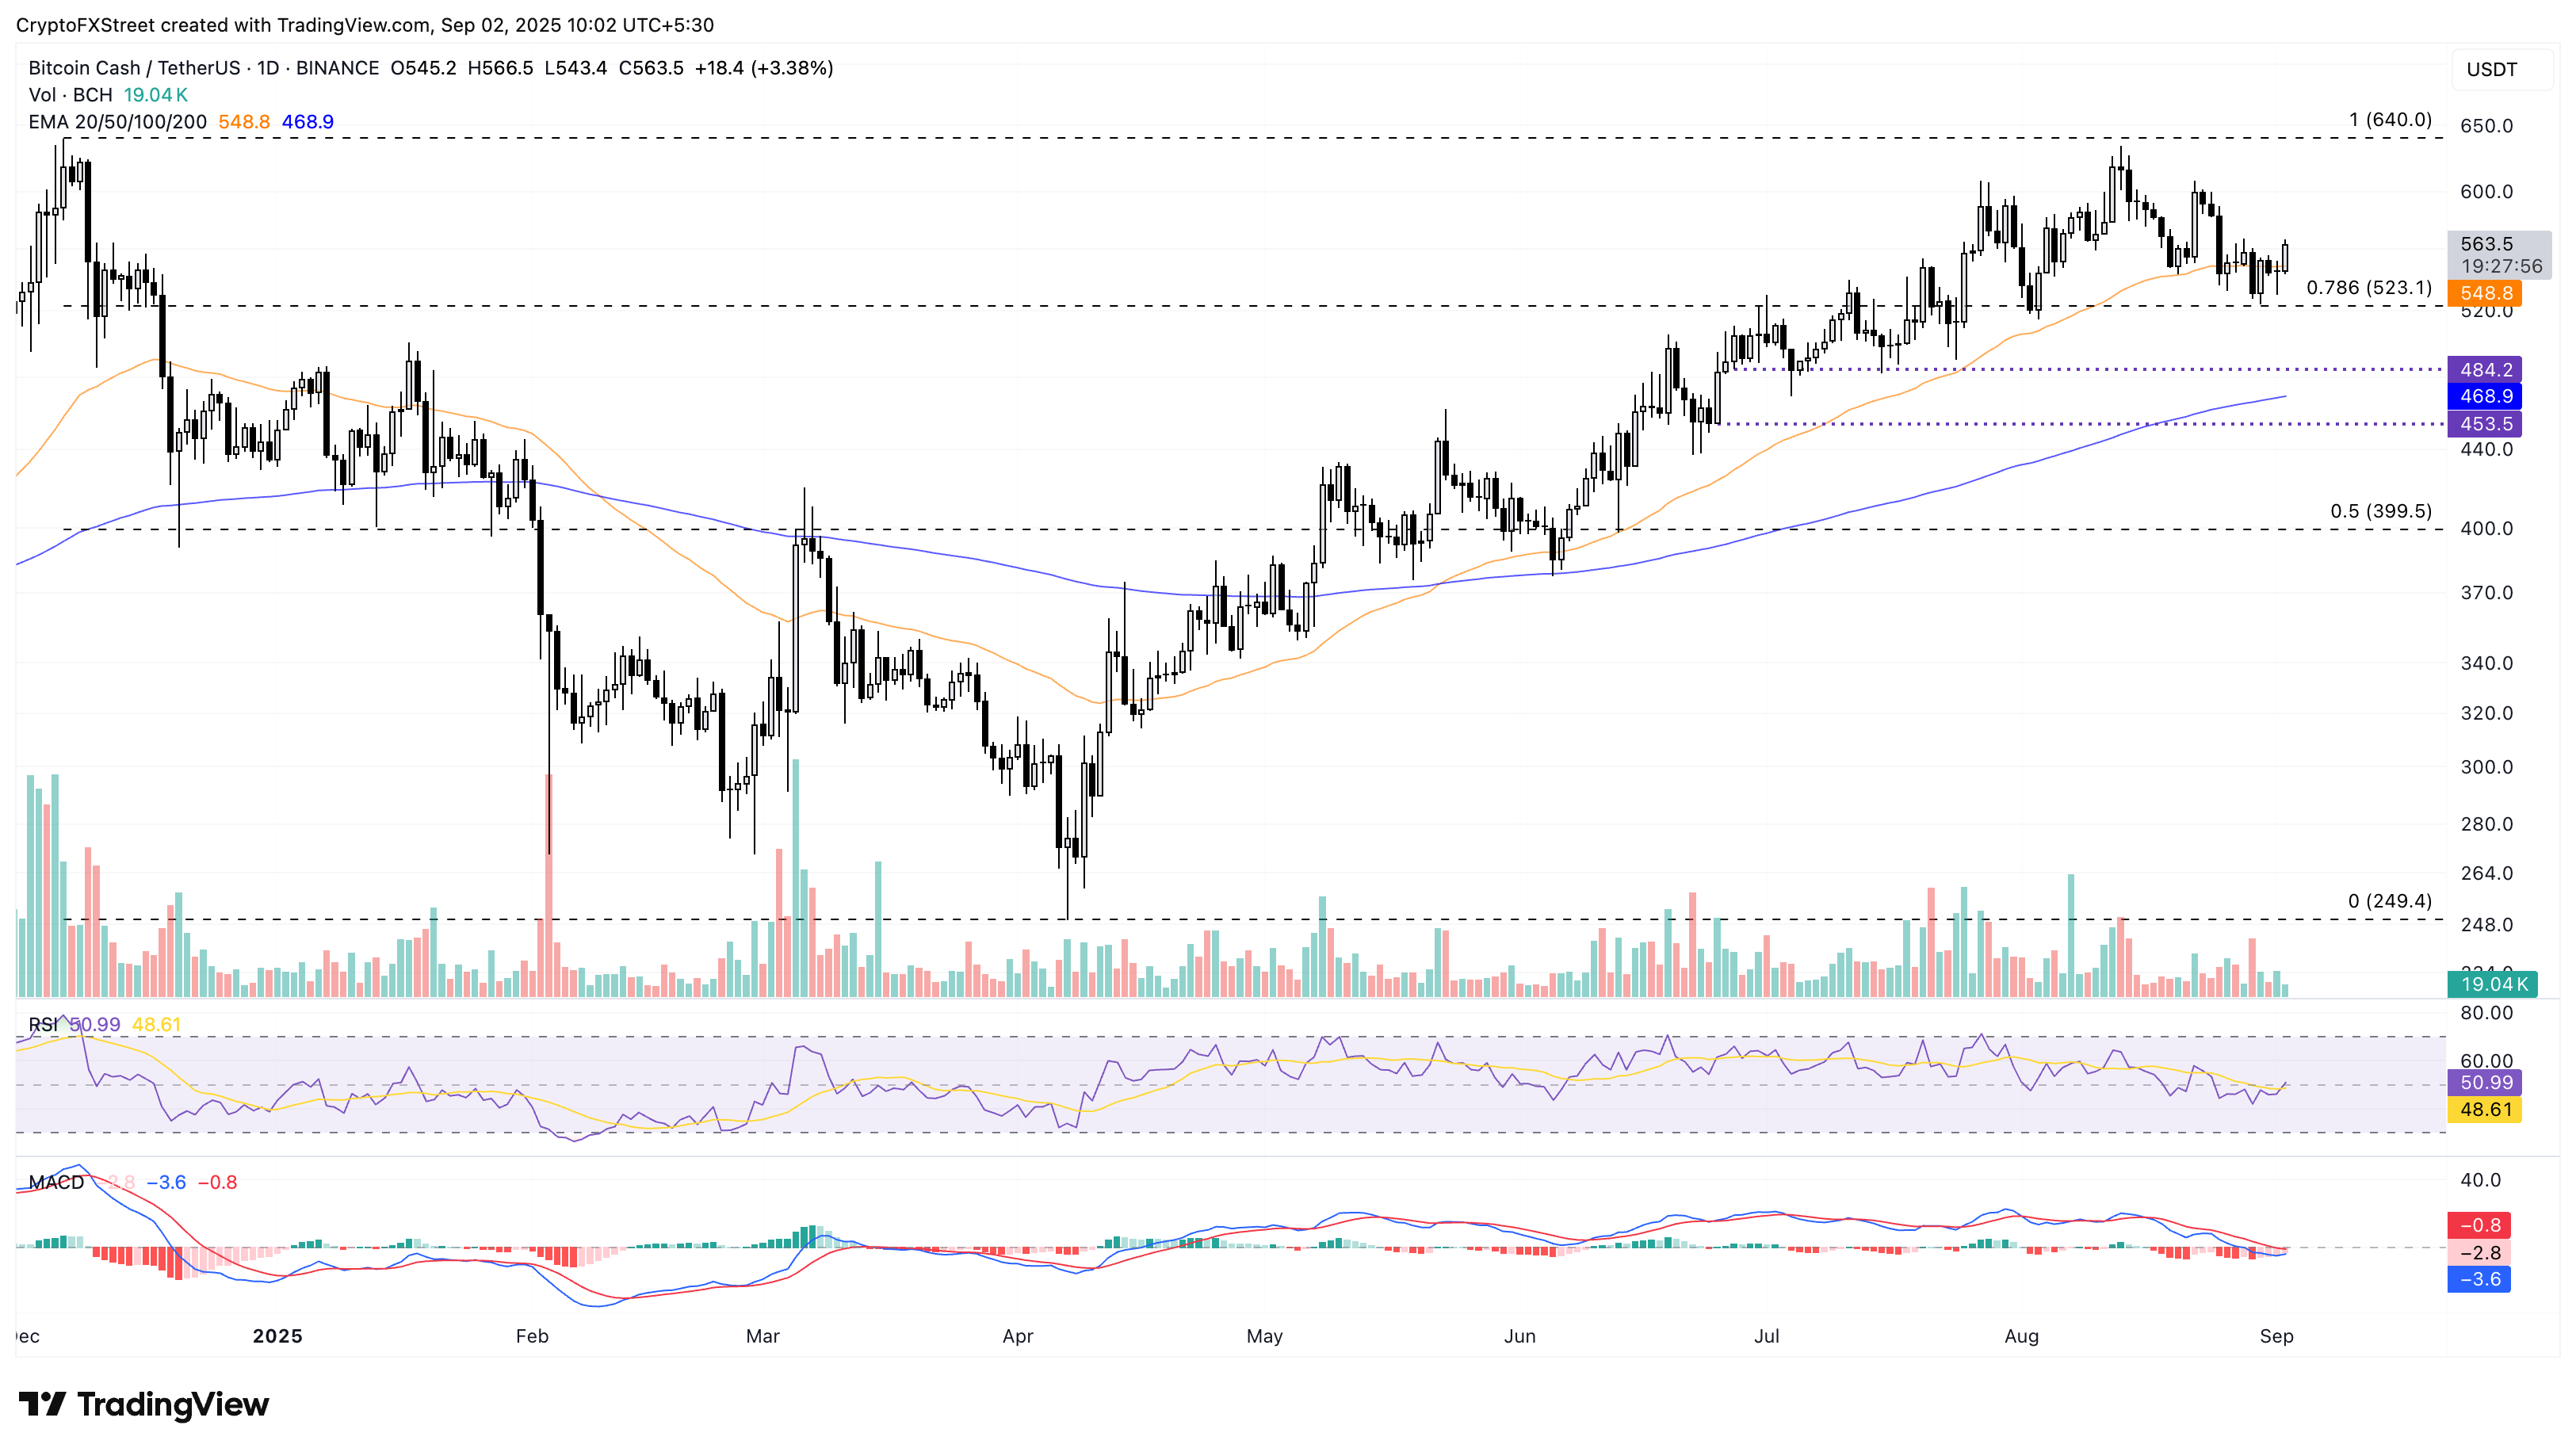
BCH/USDT daily price chart.
Looking down, a decisive close below $523 would invalidate the rebound possibilities. In such a scenario, BCH could extend the decline to the $500 psychological level or the $484 support level last tested on July 15.

FXStreet
Über eine Million Nutzer verlassen sich auf FXStreet für Echtzeit-Marktdaten, Charting-Tools, Experteneinblicke und Forex-News. Der umfassende Wirtschaftskalender und die Bildungs-Webinare helfen Tradern, informiert zu bleiben und fundierte Entscheidungen zu treffen. FXStreet wird von einem Team von rund 60 Fachleuten getragen, verteilt auf den Hauptsitz in Barcelona und verschiedene Regionen weltweit.
Read More


