
Trade The World
BNB Price Forecast: On the verge of breakout as derivatives traders bet on gains
Von Manish Chhetri
Veröffentlichungsdatum: 13 Jan 2026 | Änderungsdatum: 13 Jan 2026


POPULAR ARTICLES

BNB (BNB), formerly known as Binance Coin, is trading above $910 at the time of writing on Tuesday, nearing the upper consolidation boundary. The two months of sideways price action could end, with improving sentiment in the derivatives market suggesting potential upside.
- BNB price nears the upper boundary of its recent consolidation range after trading within in for around two months.
- Derivatives metrics support bullish sentiment as open interest and long bets rise alongside positive funding rates.
- The technical outlook indicates that any breakout could reach the $1,064 target.
BNB (BNB), formerly known as Binance Coin, is trading above $910 at the time of writing on Tuesday, nearing the upper consolidation boundary. The two months of sideways price action could end, with improving sentiment in the derivatives market suggesting potential upside. On the technical side, a confirmed breakout could open the door for a rally toward the $1,064 target.
BNB’s derivatives data support bullish bias
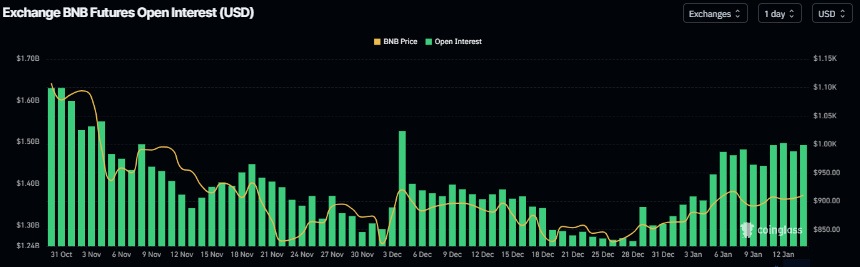
CoinGlass’ data show that futures OI in BNB at exchanges surged to $1.50 billion on Tuesday, up from $1.30 billion on December 31, the highest level since early December. An increasing OI indicates new or additional money entering the market and increased buying, which could fuel a breakout in BNB's price.
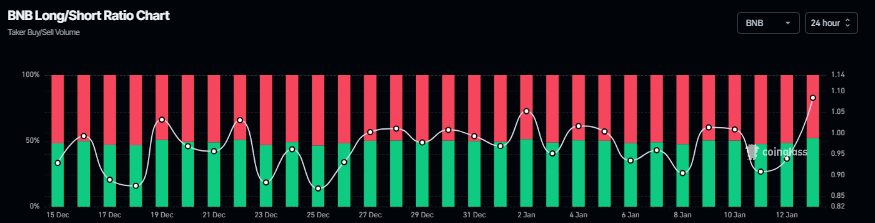
BNB’s Coinglass long-to-short ratio reads 1.08 on Tuesday, the highest level in over a month. This ratio, above one, reflects bullish sentiment in the markets, as more traders are betting on the BNB price to rise.
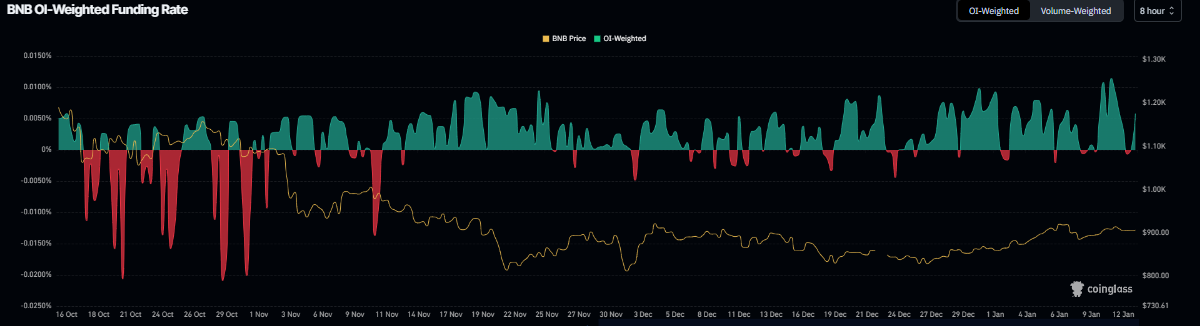
Another bullish sign for BNB is that its funding rates data turned positive on Tuesday. CoinGlass’s OI-Weighted Funding Rate data shows that the number of traders betting that the price of BNB coin will slide further is lower than that anticipating a price increase. The metric has flipped to positive, reading 0.0058% on Tuesday, indicating that longs are paying shorts. Generally, as shown in the chart below, when funding rates have flipped from negative to positive, the BNB price has rallied sharply.
Some other signs of optimism
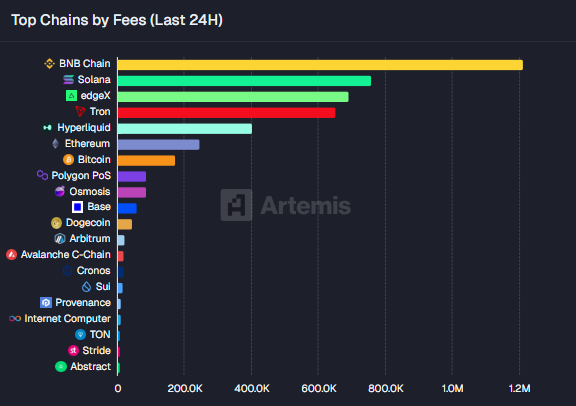
According to Artemis Terminal data, BNB Chain's 24-hour chain fee collection is $1.2 million, topping the list of other networks such as Solana and edgeX, indicating growing interest among traders and liquidity on the BNB chain.
BNB Price Forecast: BNB breakout targets $1,064
BNB has been trading within a horizontal parallel channel between $818 and $931.74 for nearly two months. Price action is gradually reclaiming key moving averages, with the 100-day Exponential Moving Average (EMA) at $909.04 as immediate resistance and the 50-day EMA and a 200-day EMA at $894 and $879.82, respectively, as immediate supports. As of writing on Tuesday, BNB is nearing the upper consolidation range.
If BNB breaks and closes above the upper boundary at $931.74 on a daily basis, it could extend the rally toward $1,064.45, the technical target of the horizontal parallel channel (height between the channel, measured from the breakout point).
The Relative Strength Index (RSI) on the daily chart reads 60, above the neutral level of 50, indicating bullish momentum gaining traction. The Moving Average Convergence Divergence (MACD) showed a bullish crossover, which remains intact, further supporting the bullish view.
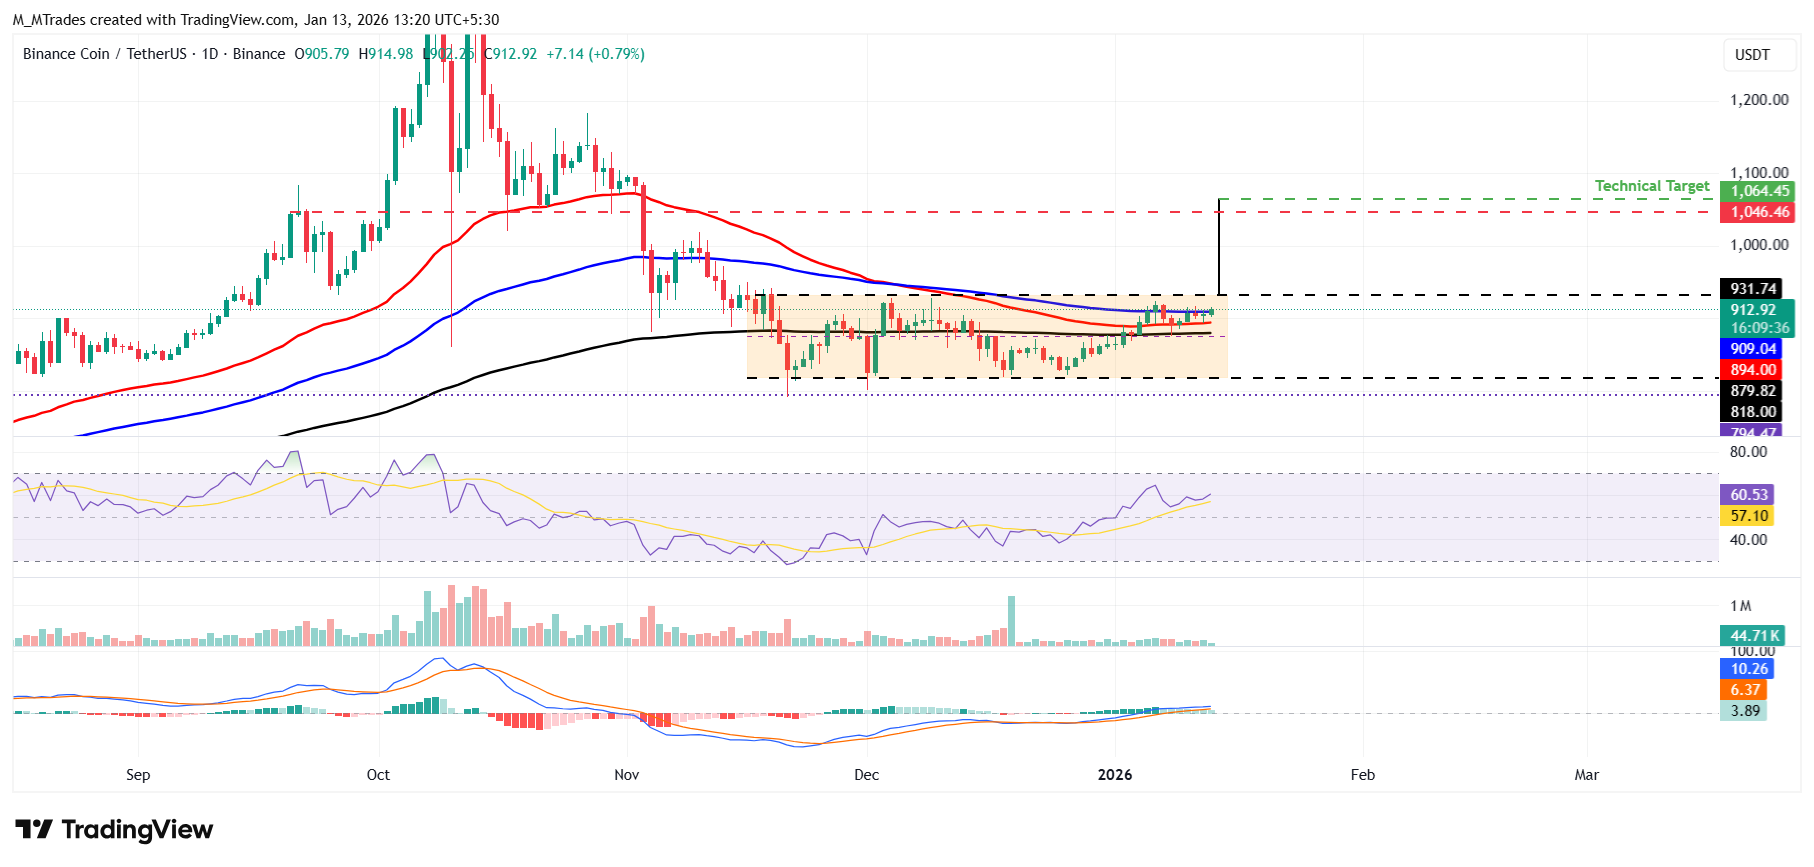
On the other hand, if BNB experiences a correction, it could extend the decline toward the immediate support levels at $879.82, its 200-day EMA.

FXStreet
Über eine Million Nutzer verlassen sich auf FXStreet für Echtzeit-Marktdaten, Charting-Tools, Experteneinblicke und Forex-News. Der umfassende Wirtschaftskalender und die Bildungs-Webinare helfen Tradern, informiert zu bleiben und fundierte Entscheidungen zu treffen. FXStreet wird von einem Team von rund 60 Fachleuten getragen, verteilt auf den Hauptsitz in Barcelona und verschiedene Regionen weltweit.
Read More


