
Trade The World
EUR/JPY Price Forecast: Hits record highs near 180.00 on bullish breakout
Von Akhtar Faruqui
Veröffentlichungsdatum: 13 Nov 2025 | Änderungsdatum: 13 Nov 2025


POPULAR ARTICLES

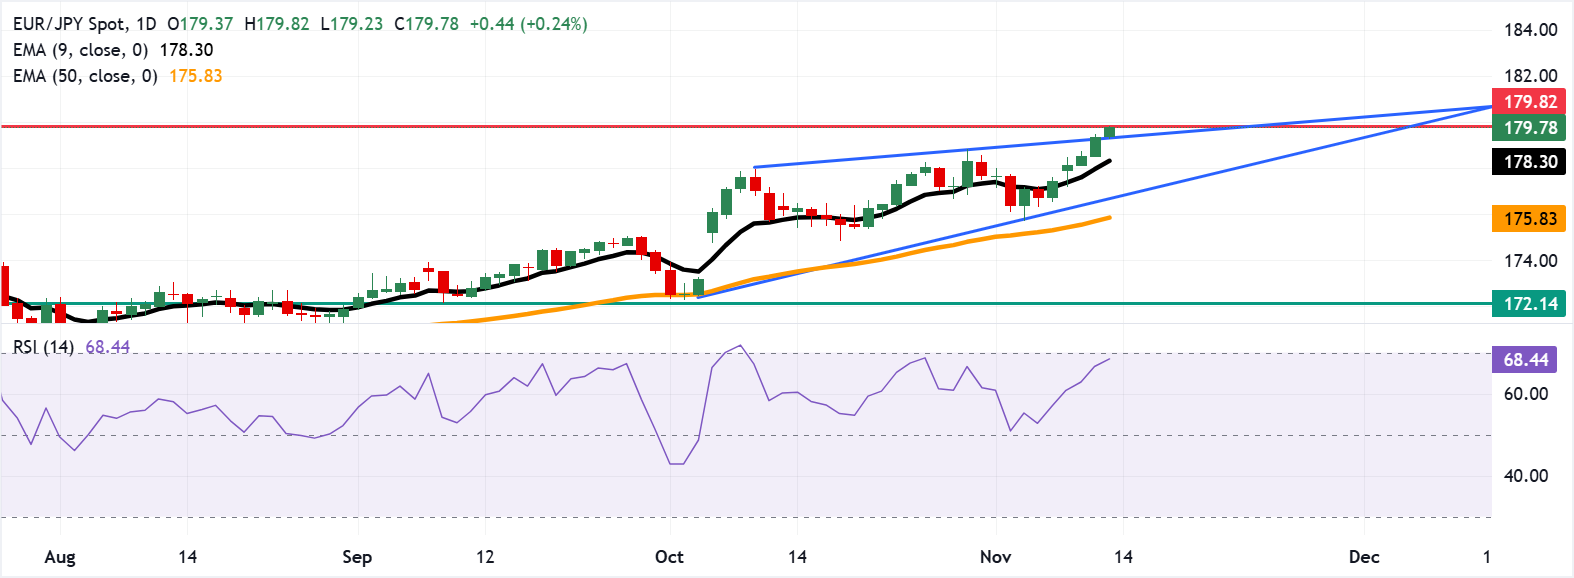
EUR/JPY extends its winning streak for the fifth successive session, trading near a fresh all-time high of 179.82 during the European hours on Thursday. The currency cross breaks above the upper resistance of an ascending wedge pattern, signalling strong buying pressure and a bullish breakout.
- EUR/JPY reached a record high of 179.82 on Thursday after breaking above the upper ascending wedge resistance.
- The 14-day Relative Strength Index holds slightly below the 70 level, strengthening the bullish bias.
- The immediate support lies at the psychological level of 179.00 within the ascending wedge.
EUR/JPY extends its winning streak for the fifth successive session, trading near a fresh all-time high of 179.82 during the European hours on Thursday. The currency cross breaks above the upper resistance of an ascending wedge pattern, signalling strong buying pressure and a bullish breakout.
The 14-day Relative Strength Index (RSI) is positioned slightly below the 70 mark, reinforcing the bullish bias. However, a move above 70 would indicate overbought conditions and raise the likelihood of a near-term downward correction. The EUR/JPY cross suggests a stronger short-term momentum, rising above the nine-day Exponential Moving Average (EMA).
On the upside, the EUR/JPY cross may reach fresh record highs near the psychological level of 180.00, followed by another crucial level of 182.00 amid persisting bullish bias.
The pullback toward the ascending wedge would revive the bearish pattern and prompt the EUR/JPY cross to test the psychological level of 179.00, followed by the nine-day EMA at 178.30. Further declines below the latter would dampen the short-term price momentum and prompt the currency cross to test the descending boundary of the ascending wedge around 176.70, followed by the 50-day EMA at 175.83.
Euro Price Today
The table below shows the percentage change of Euro (EUR) against listed major currencies today. Euro was the strongest against the US Dollar.
| USD | EUR | GBP | JPY | CAD | AUD | NZD | CHF | |
|---|---|---|---|---|---|---|---|---|
| USD | -0.21% | -0.07% | -0.05% | -0.08% | -0.58% | -0.21% | -0.28% | |
| EUR | 0.21% | 0.14% | 0.16% | 0.13% | -0.36% | 0.00% | -0.07% | |
| GBP | 0.07% | -0.14% | 0.04% | -0.01% | -0.51% | -0.14% | -0.21% | |
| JPY | 0.05% | -0.16% | -0.04% | -0.05% | -0.55% | -0.21% | -0.25% | |
| CAD | 0.08% | -0.13% | 0.00% | 0.05% | -0.49% | -0.12% | -0.20% | |
| AUD | 0.58% | 0.36% | 0.51% | 0.55% | 0.49% | 0.37% | 0.31% | |
| NZD | 0.21% | -0.01% | 0.14% | 0.21% | 0.12% | -0.37% | -0.08% | |
| CHF | 0.28% | 0.07% | 0.21% | 0.25% | 0.20% | -0.31% | 0.08% |
The heat map shows percentage changes of major currencies against each other. The base currency is picked from the left column, while the quote currency is picked from the top row. For example, if you pick the Euro from the left column and move along the horizontal line to the US Dollar, the percentage change displayed in the box will represent EUR (base)/USD (quote).

FXStreet
Über eine Million Nutzer verlassen sich auf FXStreet für Echtzeit-Marktdaten, Charting-Tools, Experteneinblicke und Forex-News. Der umfassende Wirtschaftskalender und die Bildungs-Webinare helfen Tradern, informiert zu bleiben und fundierte Entscheidungen zu treffen. FXStreet wird von einem Team von rund 60 Fachleuten getragen, verteilt auf den Hauptsitz in Barcelona und verschiedene Regionen weltweit.
Read More


