
Trade The World
EUR/JPY Price Forecast: Targets 176.00 support near nine-day EMA
Von Akhtar Faruqui
Veröffentlichungsdatum: 22 Oct 2025 | Änderungsdatum: 22 Oct 2025


POPULAR ARTICLES

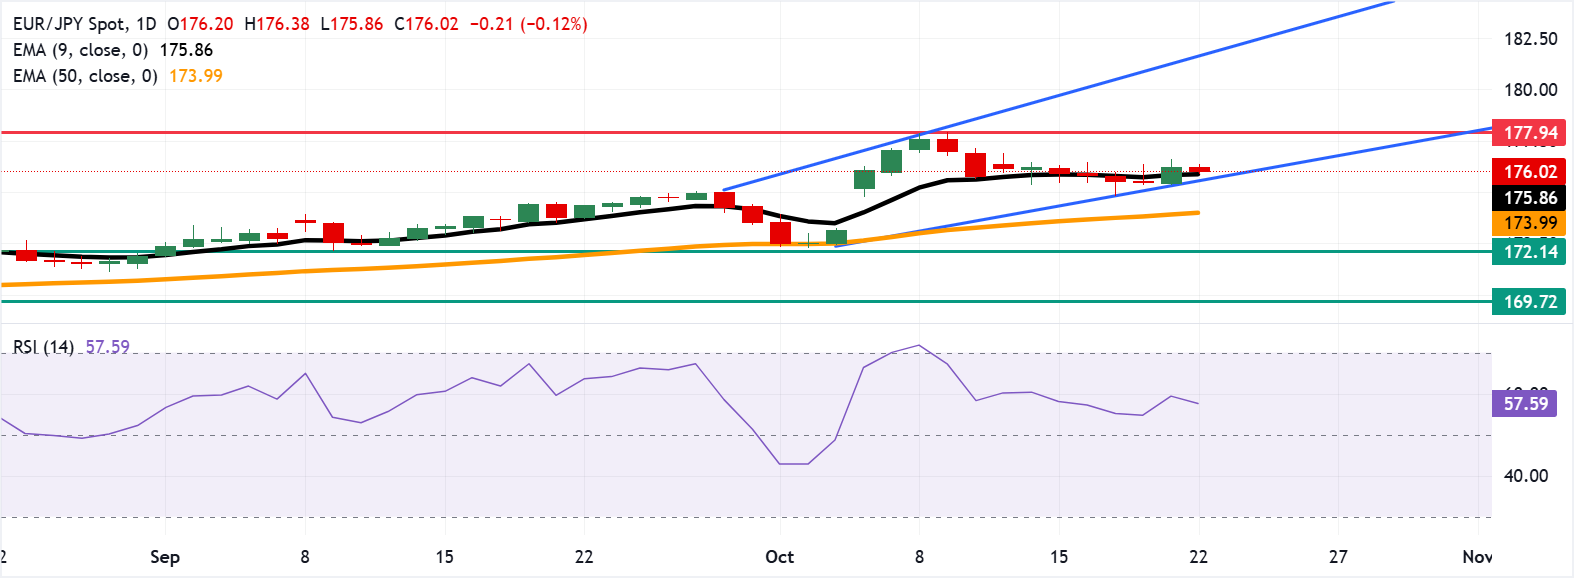
EUR/JPY dips slightly after posting strong gains in the previous session, trading around 176.10 during the European hours on Wednesday. The technical analysis of the daily chart indicates a prevailing bullish bias as the currency cross remains within the ascending channel pattern.
- EUR/JPY may find initial resistance at the record high of 177.94.
- The short-term momentum remains stronger as the currency cross is positioned above the nine-day EMA.
- The primary support lies at the psychological level of 176.00.
EUR/JPY dips slightly after posting strong gains in the previous session, trading around 176.10 during the European hours on Wednesday. The technical analysis of the daily chart indicates a prevailing bullish bias as the currency cross remains within the ascending channel pattern.
The short-term price momentum is stronger as the EUR/JPY cross is positioned above the nine-day Exponential Moving Average (EMA). Additionally, the 14-day Relative Strength Index (RSI) remains above the 50 mark, strengthening the bullish bias.
On the upside, the EUR/JPY cross may target the all-time high of 177.94, which was recorded on October 9. A break above this level would open the door for the currency cross to explore the region around the upper boundary of the ascending channel around 181.70.
The EUR/JPY cross may find its immediate support at the psychological level of 176.00, followed by the nine-day EMA of 175.86 and the ascending channel’s lower boundary around 175.50. A break below this confluence support zone would weaken the short-term price momentum and put downward pressure on the currency cross to navigate the region around the 50-day EMA at 173.99.
Further declines would dampen the medium-term price momentum and prompt the EUR/JPY cross to test the six-week low of 172.14, which was recorded on September 9.
EUR/JPY: Daily Chart
Euro Price Today
The table below shows the percentage change of Euro (EUR) against listed major currencies today. Euro was the weakest against the Australian Dollar.
| USD | EUR | GBP | JPY | CAD | AUD | NZD | CHF | |
|---|---|---|---|---|---|---|---|---|
| USD | 0.04% | 0.36% | -0.11% | -0.11% | -0.15% | -0.15% | 0.00% | |
| EUR | -0.04% | 0.31% | -0.14% | -0.16% | -0.20% | -0.17% | -0.04% | |
| GBP | -0.36% | -0.31% | -0.44% | -0.46% | -0.51% | -0.48% | -0.35% | |
| JPY | 0.11% | 0.14% | 0.44% | -0.02% | -0.05% | -0.04% | 0.12% | |
| CAD | 0.11% | 0.16% | 0.46% | 0.02% | -0.05% | -0.02% | 0.11% | |
| AUD | 0.15% | 0.20% | 0.51% | 0.05% | 0.05% | 0.03% | 0.16% | |
| NZD | 0.15% | 0.17% | 0.48% | 0.04% | 0.02% | -0.03% | 0.13% | |
| CHF | -0.01% | 0.04% | 0.35% | -0.12% | -0.11% | -0.16% | -0.13% |
The heat map shows percentage changes of major currencies against each other. The base currency is picked from the left column, while the quote currency is picked from the top row. For example, if you pick the Euro from the left column and move along the horizontal line to the US Dollar, the percentage change displayed in the box will represent EUR (base)/USD (quote).

FXStreet
Über eine Million Nutzer verlassen sich auf FXStreet für Echtzeit-Marktdaten, Charting-Tools, Experteneinblicke und Forex-News. Der umfassende Wirtschaftskalender und die Bildungs-Webinare helfen Tradern, informiert zu bleiben und fundierte Entscheidungen zu treffen. FXStreet wird von einem Team von rund 60 Fachleuten getragen, verteilt auf den Hauptsitz in Barcelona und verschiedene Regionen weltweit.
Read More


