
Trade The World
EUR/JPY Price Forecast: Tests 180.50 support near nine-day EMA
Von Akhtar Faruqui
Veröffentlichungsdatum: 25 Nov 2025 | Änderungsdatum: 25 Nov 2025


POPULAR ARTICLES

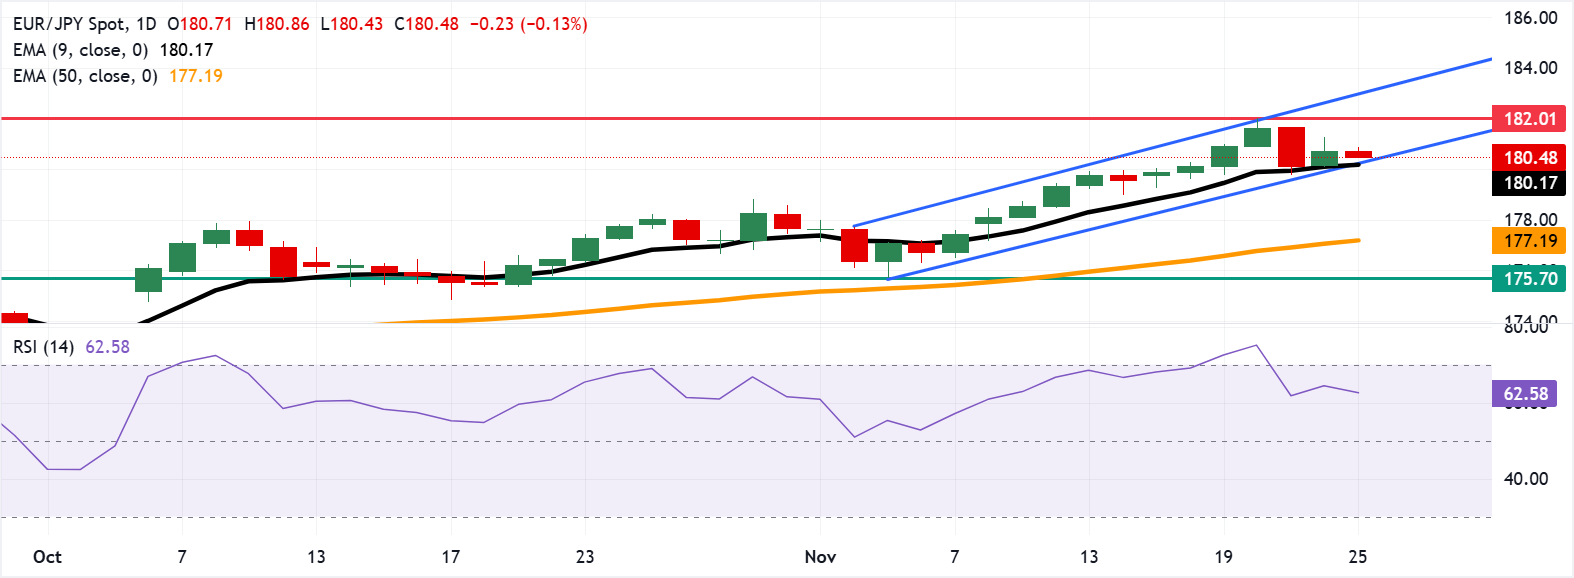
EUR/JPY depreciates after registering more than 0.25% in the previous session, trading around 180.50 during the early European hours on Tuesday. The currency cross moves upwards within the ascending channel pattern, suggesting a persistent bullish bias.
- EUR/JPY may find initial resistance at the record high of 182.01.
- The short-term average holds above the 50-day EMA, maintaining a bullish bias.
- The immediate support is seen at the nine-day EMA of 180.17.
EUR/JPY depreciates after registering more than 0.25% in the previous session, trading around 180.50 during the early European hours on Tuesday. The currency cross moves upwards within the ascending channel pattern, suggesting a persistent bullish bias.
The EUR/JPY cross holds above the rising nine-day Exponential Moving Average (EMA) at 180.17 and the 50-day EMA at 177.19. The short-term average remains above the 50-day EMA, preserving a bullish bias. Additionally, the 14-day Relative Strength Index (RSI) prints 62.66 (bullish), easing from last week’s overbought stretch.
On the upside, the initial resistance appears at the all-time high of 182.01, followed by the upper boundary of the ascending channel around 182.10. Further advances above the channel would reinforce the bullish bias and lead the EUR/JPY cross to approach the crucial level of 183.00.
The immediate support lies at the nine-day EMA of 180.17, aligned with the lower boundary of the ascending channel. Further declines below the confluence support zone would weaken the bullish bias and put downward pressure on the EUR/JPY cross to navigate the area around the 50-day EMA at 177.19.
(The technical analysis of this story was written with the help of an AI tool)
Euro Price Today
The table below shows the percentage change of Euro (EUR) against listed major currencies today. Euro was the weakest against the Japanese Yen.
| USD | EUR | GBP | JPY | CAD | AUD | NZD | CHF | |
|---|---|---|---|---|---|---|---|---|
| USD | -0.06% | -0.13% | -0.16% | 0.04% | 0.14% | 0.21% | 0.07% | |
| EUR | 0.06% | -0.07% | -0.11% | 0.10% | 0.19% | 0.26% | 0.13% | |
| GBP | 0.13% | 0.07% | -0.04% | 0.17% | 0.27% | 0.34% | 0.20% | |
| JPY | 0.16% | 0.11% | 0.04% | 0.20% | 0.30% | 0.35% | 0.23% | |
| CAD | -0.04% | -0.10% | -0.17% | -0.20% | 0.10% | 0.15% | 0.03% | |
| AUD | -0.14% | -0.19% | -0.27% | -0.30% | -0.10% | 0.07% | -0.09% | |
| NZD | -0.21% | -0.26% | -0.34% | -0.35% | -0.15% | -0.07% | -0.13% | |
| CHF | -0.07% | -0.13% | -0.20% | -0.23% | -0.03% | 0.09% | 0.13% |
The heat map shows percentage changes of major currencies against each other. The base currency is picked from the left column, while the quote currency is picked from the top row. For example, if you pick the Euro from the left column and move along the horizontal line to the US Dollar, the percentage change displayed in the box will represent EUR (base)/USD (quote).

FXStreet
Über eine Million Nutzer verlassen sich auf FXStreet für Echtzeit-Marktdaten, Charting-Tools, Experteneinblicke und Forex-News. Der umfassende Wirtschaftskalender und die Bildungs-Webinare helfen Tradern, informiert zu bleiben und fundierte Entscheidungen zu treffen. FXStreet wird von einem Team von rund 60 Fachleuten getragen, verteilt auf den Hauptsitz in Barcelona und verschiedene Regionen weltweit.
Read More


