
EUR/USD Price Forecast: Tests nine-day EMA barrier near 1.1650
Von Akhtar Faruqui
Veröffentlichungsdatum: 20 Jan 2026 | Änderungsdatum: 20 Jan 2026


BELIEBTE ARTIKEL

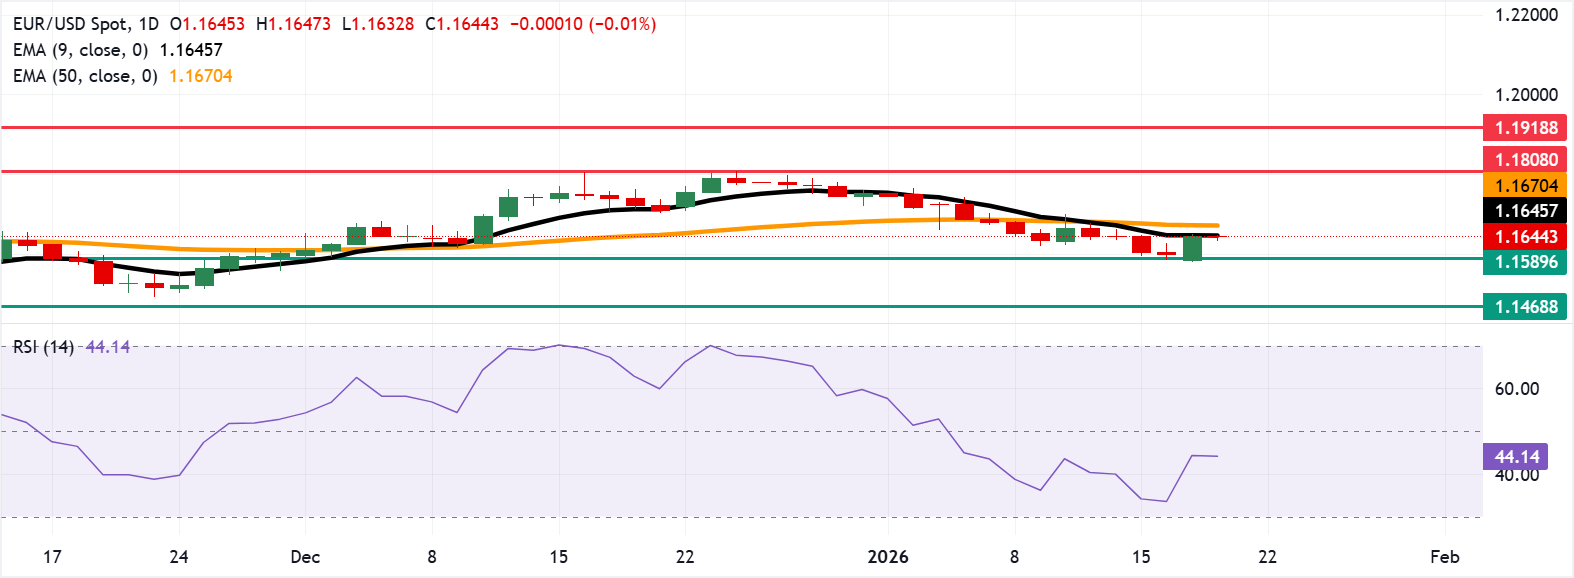
EUR/USD moves little after registering modest gains in the previous session, trading around 1.1640 during the Asian hours on Tuesday. The 14-day Relative Strength Index (RSI) momentum indicator, at 44 (neutral-to-bearish), confirms fading momentum.
- EUR/USD could fall toward the seven-week low at 1.1589.
- The 14-day Relative Strength Index, at 44, signals fading momentum.
- The immediate resistance lies at the nine-day EMA of 1.1645.
EUR/USD moves little after registering modest gains in the previous session, trading around 1.1640 during the Asian hours on Tuesday. The 14-day Relative Strength Index (RSI) momentum indicator, at 44 (neutral-to-bearish), confirms fading momentum.
The technical analysis of the daily chart shows that the EUR/USD pair remains below the 50-day Exponential Moving Average (EMA) and slips under the nine-day EMA, preserving a bearish bias. The short-term average stands beneath the medium-term gauge, reinforcing downside pressure.
Below the nine-day EMA and 50-day EMA, rallies would remain capped, and a close under the seven-week low at 1.1589, set on December 1, would open the door to the next support around 1.1468, the lowest since August 2025.
A recovery through the nine-day EMA at 1.1645 would ease pressure and set a path toward the 50-day EMA at 1.1670. The 50-EMA’s gentle downturn suggests sellers retain control, though a base above the medium-term average would shift the bias back to balance and support the EUR/USD pair to explore the region around the three-month high of 1.1808, which was recorded on December 24, followed by the 1.1918, the highest level since June 2021.
(The technical analysis of this story was written with the help of an AI tool.)
Euro Price Today
The table below shows the percentage change of Euro (EUR) against listed major currencies today. Euro was the strongest against the British Pound.
| USD | EUR | GBP | JPY | CAD | AUD | NZD | CHF | |
|---|---|---|---|---|---|---|---|---|
| USD | 0.00% | 0.02% | -0.05% | 0.02% | 0.00% | -0.33% | -0.03% | |
| EUR | -0.00% | 0.03% | -0.07% | 0.02% | 0.00% | -0.33% | -0.00% | |
| GBP | -0.02% | -0.03% | -0.06% | 0.00% | -0.01% | -0.34% | -0.05% | |
| JPY | 0.05% | 0.07% | 0.06% | 0.08% | 0.06% | -0.28% | 0.03% | |
| CAD | -0.02% | -0.02% | -0.00% | -0.08% | -0.01% | -0.35% | -0.04% | |
| AUD | -0.01% | -0.01% | 0.01% | -0.06% | 0.01% | -0.33% | -0.01% | |
| NZD | 0.33% | 0.33% | 0.34% | 0.28% | 0.35% | 0.33% | 0.29% | |
| CHF | 0.03% | 0.00% | 0.05% | -0.03% | 0.04% | 0.01% | -0.29% |
The heat map shows percentage changes of major currencies against each other. The base currency is picked from the left column, while the quote currency is picked from the top row. For example, if you pick the Euro from the left column and move along the horizontal line to the US Dollar, the percentage change displayed in the box will represent EUR (base)/USD (quote).

Über eine Million Nutzer verlassen sich auf FXStreet für Echtzeit-Marktdaten, Charting-Tools, Experteneinblicke und Forex-News. Der umfassende Wirtschaftskalender und die Bildungs-Webinare helfen Tradern, informiert zu bleiben und fundierte Entscheidungen zu treffen. FXStreet wird von einem Team von rund 60 Fachleuten getragen, verteilt auf den Hauptsitz in Barcelona und verschiedene Regionen weltweit.
Weiterlesen


