
Trade The World
NZD/USD Price Forecast: Drifts below 0.5740 ahead of US CPI data release
Von Guillermo Alcala
Veröffentlichungsdatum: 24 Oct 2025 | Änderungsdatum: 24 Oct 2025


POPULAR ARTICLES

The New Zealand Dollar pares previous gains and retreats below 0.5740 on Friday, from Weekly highs around 0.5760, with market movement subdued as traders await the release of the US Consumer Price Index later today.The US Dollar is trading within recent ranges against its main peers amid uncertainty
- The New Zealand Dollar gives away gains against the Dollar and drifts below 0.5740.
- The US Dollar remains firm ahead of the release of the US CPI release.
- Ongoing uncertainty about global trade is keeping the sentiment-linked NZD under pressure.
The New Zealand Dollar pares previous gains and retreats below 0.5740 on Friday, from Weekly highs around 0.5760, with market movement subdued as traders await the release of the US Consumer Price Index later today.
The US Dollar is trading within recent ranges against its main peers amid uncertainty about global trade. US President Trump called negotiations with Canada terminated a few days after announcing curbs on software exports to China, which has strained the already frail relations with the world’s two major economies, dampening investors’ appetite for risk.
Technical Analysis: NZD/USD is moving within a wedge pattern
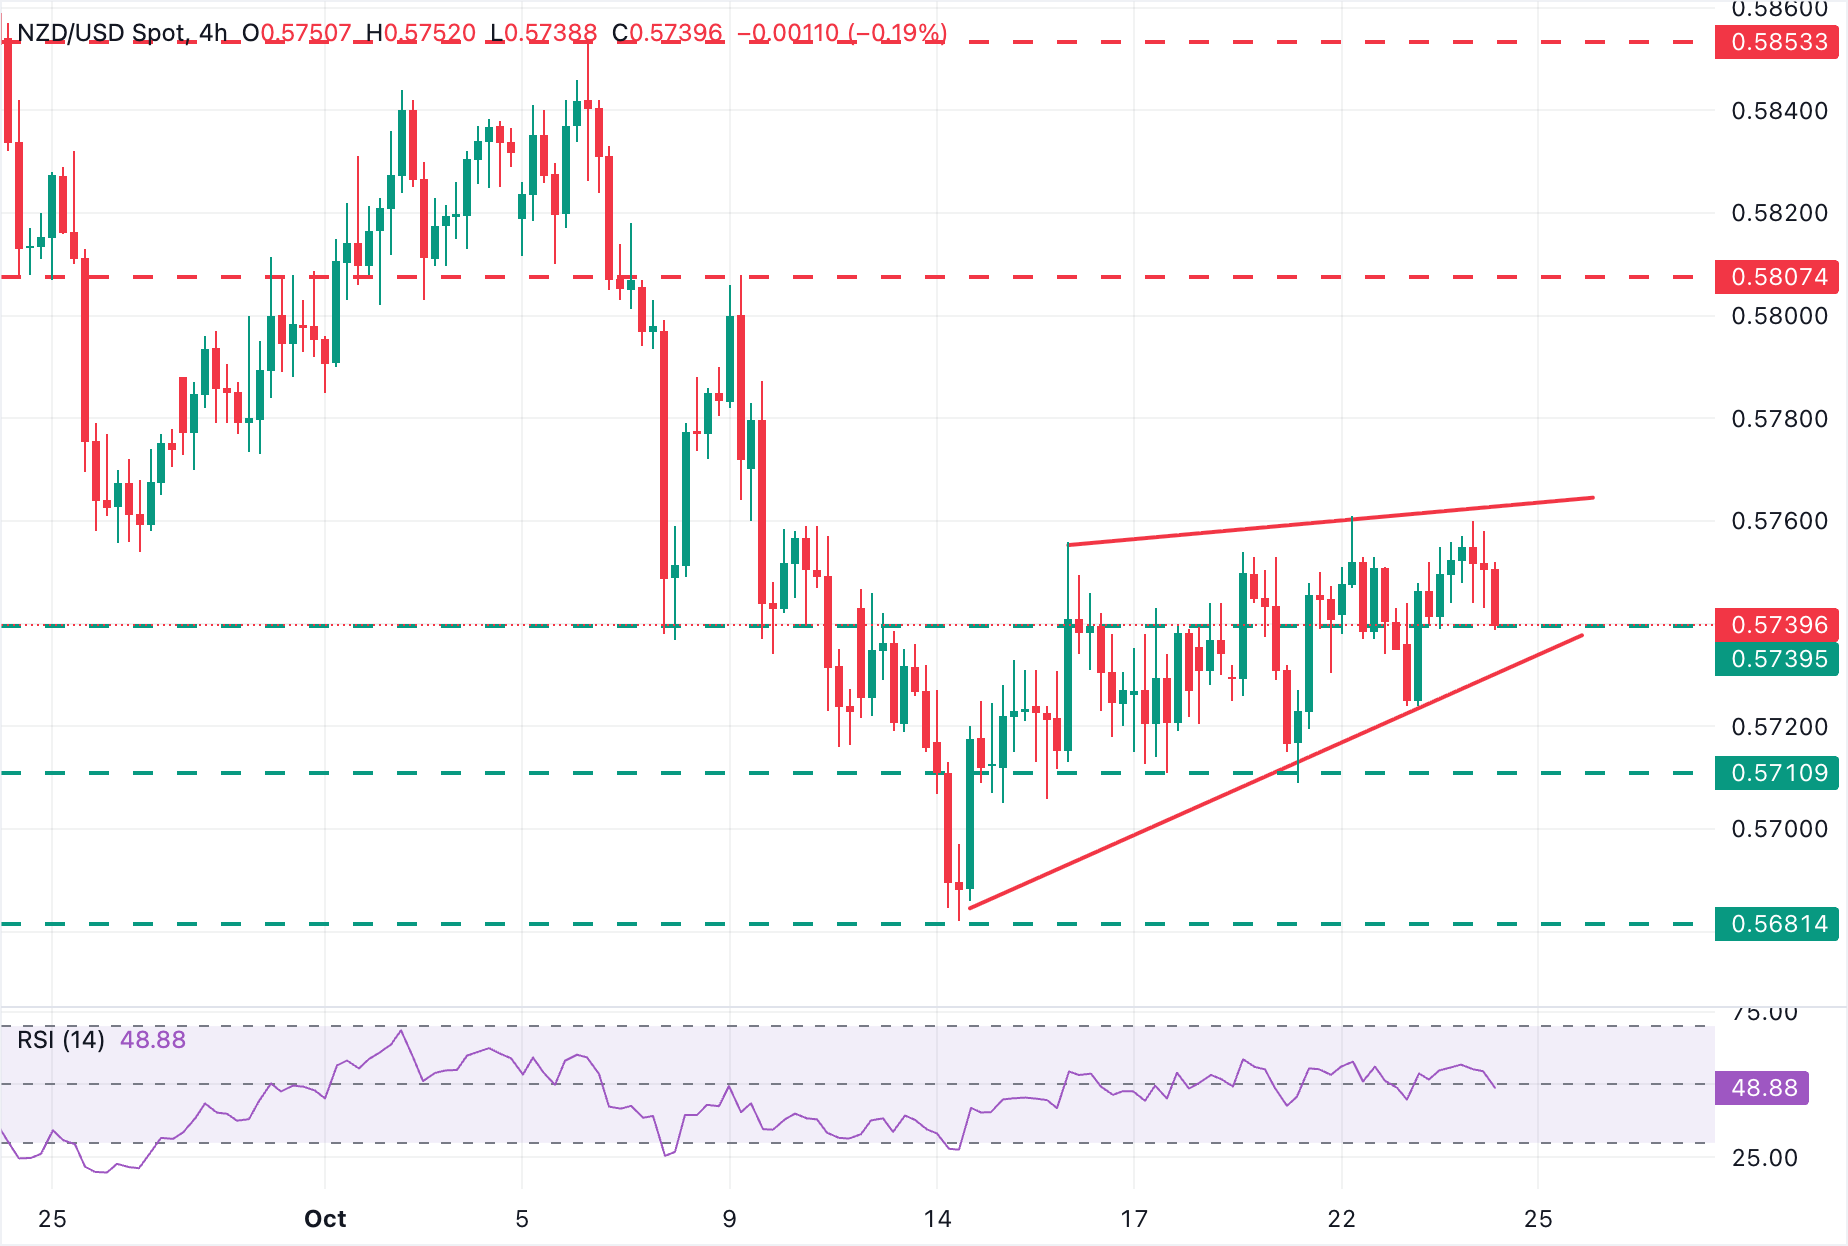
From a technical perspective, a look at the 4-hour chart shows price action moving within an ascending wedge, with resistance at the 0.5760 area, where October 10 and 22 highs cross the wedge top, capping upside attempts.
The pair is now testing an intra-day support level at 0.5740, ahead of the wedge bottom, at 0.5730. A confirmation below that level clears the way towards the 0.5700-0.5710 area, where the pair was contained on October 15, 17, and 21. Further down, the key support near 0.5680 (October 14 low) emerges as the next target.
To the upside, immediate support is at the mentioned 0.5760, ahead of the October 8 high, at 0.5805, and the October 6 high, at 0.5855.
US Dollar Price Today
The table below shows the percentage change of US Dollar (USD) against listed major currencies today. US Dollar was the strongest against the Canadian Dollar.
| USD | EUR | GBP | JPY | CAD | AUD | NZD | CHF | |
|---|---|---|---|---|---|---|---|---|
| USD | 0.08% | 0.16% | 0.24% | 0.27% | 0.24% | 0.22% | 0.19% | |
| EUR | -0.08% | 0.09% | 0.18% | 0.20% | 0.17% | 0.14% | 0.12% | |
| GBP | -0.16% | -0.09% | 0.08% | 0.10% | 0.08% | 0.04% | 0.02% | |
| JPY | -0.24% | -0.18% | -0.08% | 0.03% | -0.00% | -0.04% | -0.05% | |
| CAD | -0.27% | -0.20% | -0.10% | -0.03% | -0.04% | -0.06% | -0.09% | |
| AUD | -0.24% | -0.17% | -0.08% | 0.00% | 0.04% | -0.03% | -0.06% | |
| NZD | -0.22% | -0.14% | -0.04% | 0.04% | 0.06% | 0.03% | -0.03% | |
| CHF | -0.19% | -0.12% | -0.02% | 0.05% | 0.09% | 0.06% | 0.03% |
The heat map shows percentage changes of major currencies against each other. The base currency is picked from the left column, while the quote currency is picked from the top row. For example, if you pick the US Dollar from the left column and move along the horizontal line to the Japanese Yen, the percentage change displayed in the box will represent USD (base)/JPY (quote).

FXStreet
Über eine Million Nutzer verlassen sich auf FXStreet für Echtzeit-Marktdaten, Charting-Tools, Experteneinblicke und Forex-News. Der umfassende Wirtschaftskalender und die Bildungs-Webinare helfen Tradern, informiert zu bleiben und fundierte Entscheidungen zu treffen. FXStreet wird von einem Team von rund 60 Fachleuten getragen, verteilt auf den Hauptsitz in Barcelona und verschiedene Regionen weltweit.
Read More


