
Trade The World
Pi Network Price Forecast: PI climbs to fresh monthly high as migration boosts demand
Von Vishal Dixit
Veröffentlichungsdatum: 27 Oct 2025 | Änderungsdatum: 27 Oct 2025


POPULAR ARTICLES
Pi Network (PI) exceeds the 50-day Exponential Moving Average at $0.2638 at press time on Monday. The migration of Pi Network users, also called Pioneers, to the mainnet led to a surge in broader market demand that outpaced supply pressures.
- Pi Network hits a fresh monthly high on Monday, with bulls eyeing the $0.30 mark.
- CEXs' wallet balances record 2 million PI inflow after the recent mainnet migration of 2.69 million Pioneers.
- Technically, the 50-day EMA breakout could further boost the PI token rally.
Pi Network (PI) exceeds the 50-day Exponential Moving Average at $0.2638 at press time on Monday. The migration of Pi Network users, also called Pioneers, to the mainnet led to a surge in broader market demand that outpaced supply pressures. The technical outlook indicates a bullish trend, suggesting further gains if the PI token holds above $0.2638.
CEXs' inflows struggle to keep up with demand
Pi Network marks the fifth consecutive day of a renewed uptrend following last week's announcement that 3.36 million Pioneers completed their Know Your Customer (KYC) verification. This allowed 2.69 million Pioneers to migrate to the mainnet, while the rest might have to complete the mainnet checklist. Typically, such migration would add to supply pressure, as Pioneers can transfer their PI token holdings to Know Your Business (KYB) - verified Centralized Exchanges (CEXs).
In line with this, PiScan data shows that the CEXs' wallet balances have recorded an inflow of 2.02 million PI tokens in the last 24 hours. However, the broader market demand surge after the recent migration outpaces supply pressures, driving PI token prices higher.
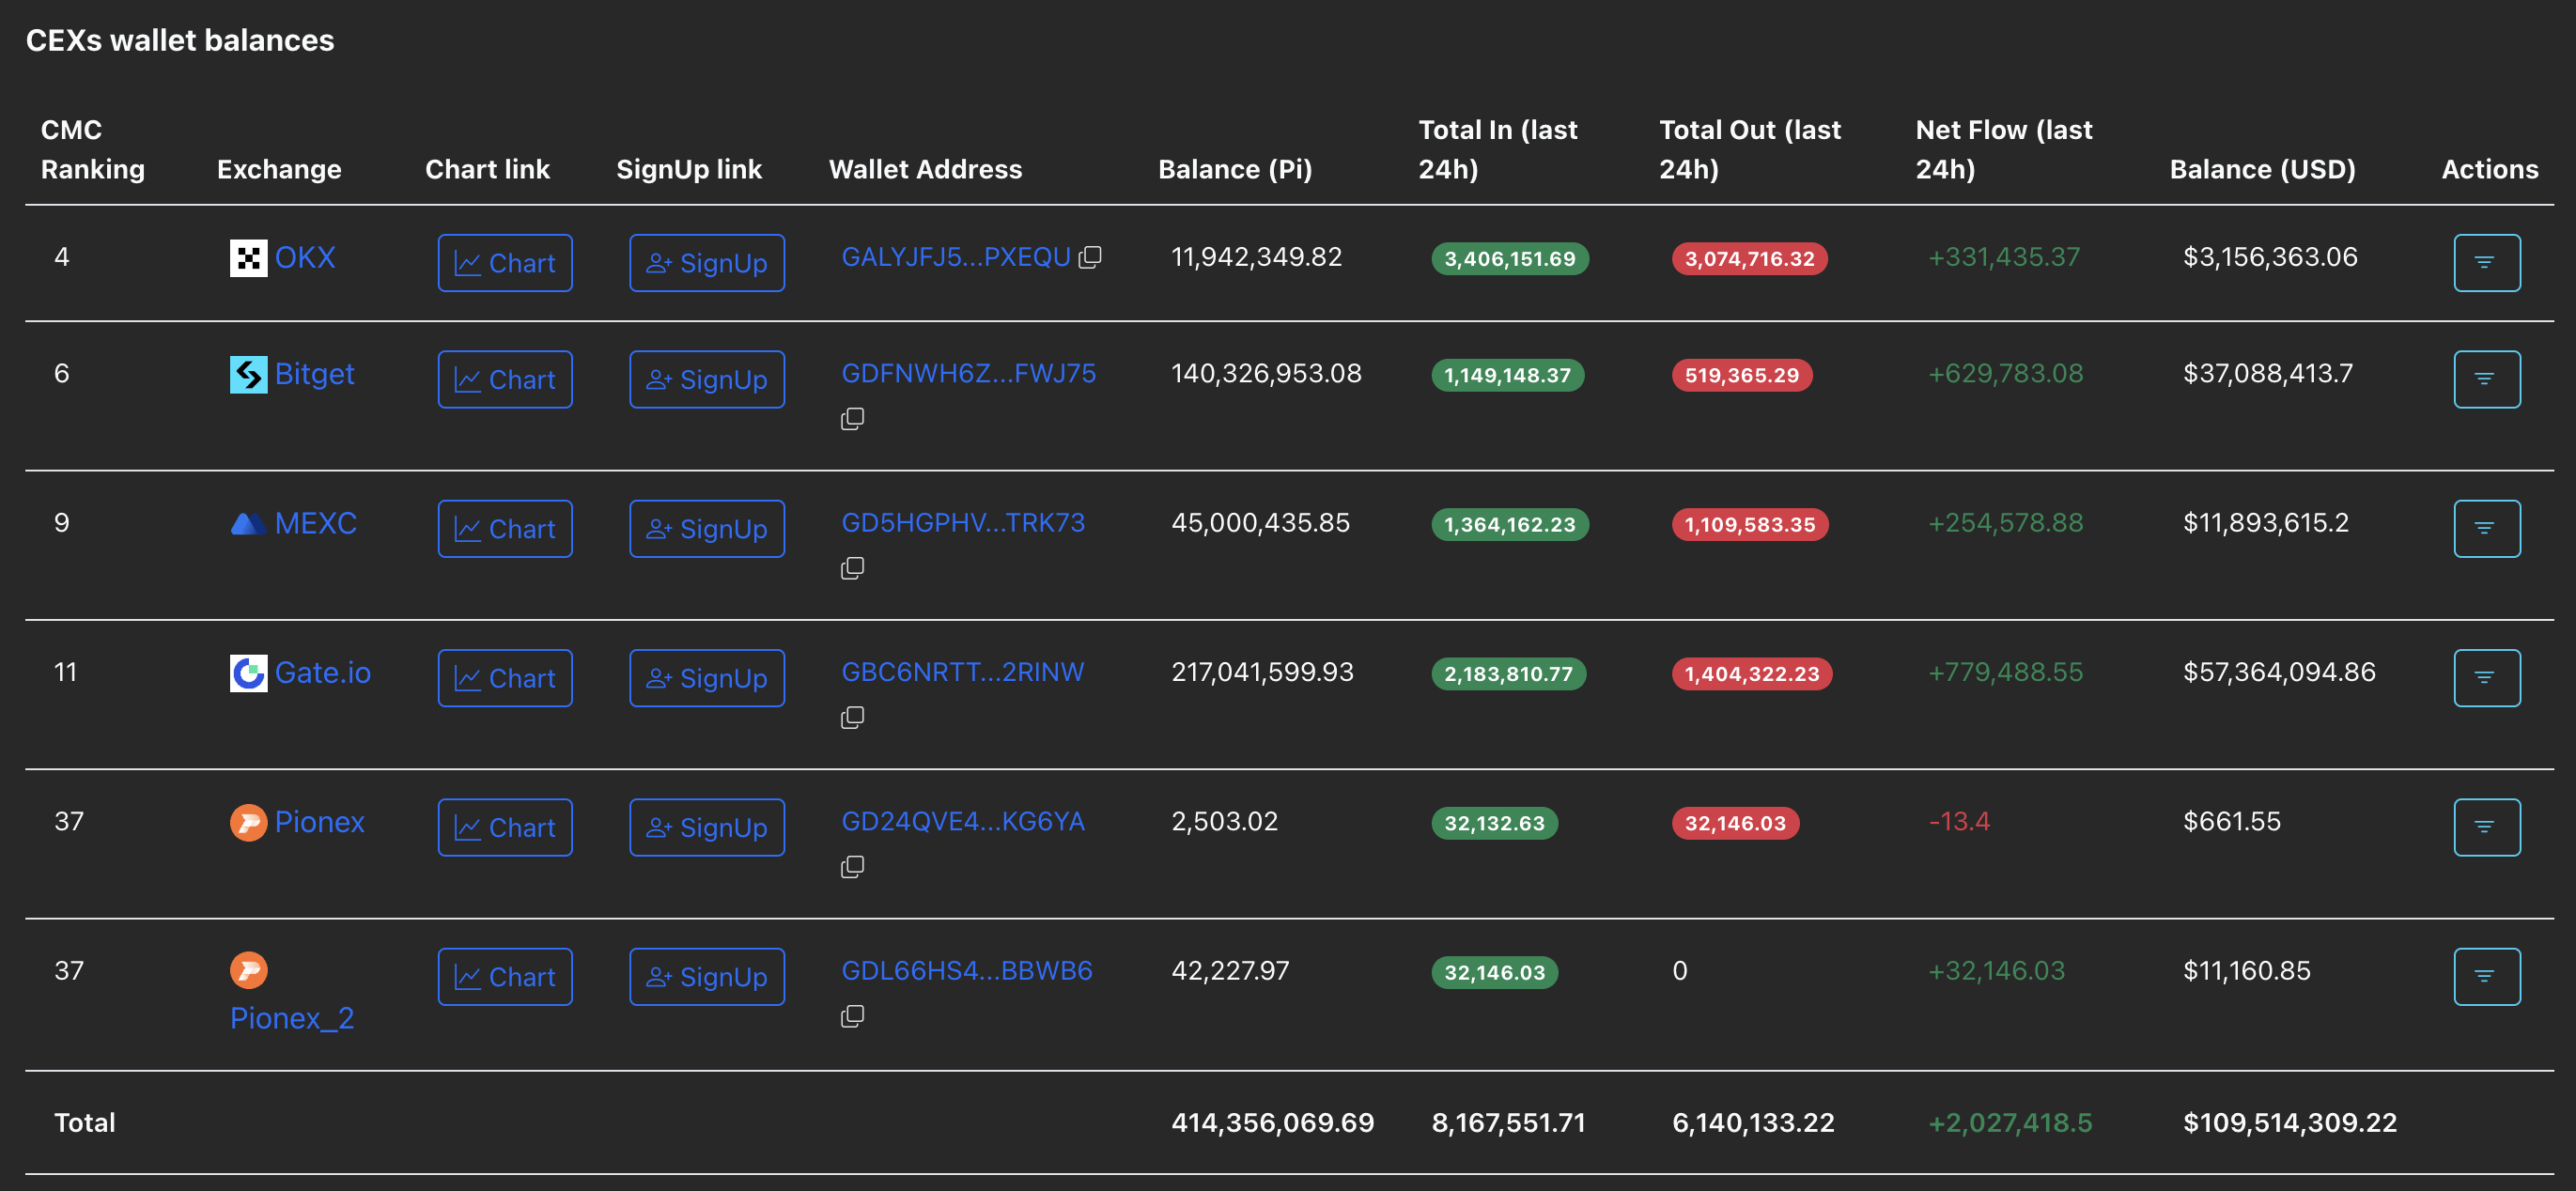
CEXs' wallet balances. Source: PiScan.
Technical outlook: Will the Pi Network sustain its recovery run?
The PI token is up 25% at press time on Monday, trading above the 50-day EMA at $0.2638. The mobile mining cryptocurrency extends its uptrend for the fifth consecutive day, with bulls eyeing $0.3220, which previously served as support in late September.
Furthermore, the PI token trades above the 50-day EMA at $0.2368, which has previously acted as a dynamic resistance providing multiple bearish reversal points. If PI holds above this average line, it could extend the recovery run.
The indicators on the daily chart suggest a surge in buying pressure, as the Relative Strength Index (RSI) at 67 is approaching the overbought boundary.
At the same time, the Moving Average Convergence Divergence (MACD) draws higher towards the zero line, coupled with a consistent rise in green histograms.
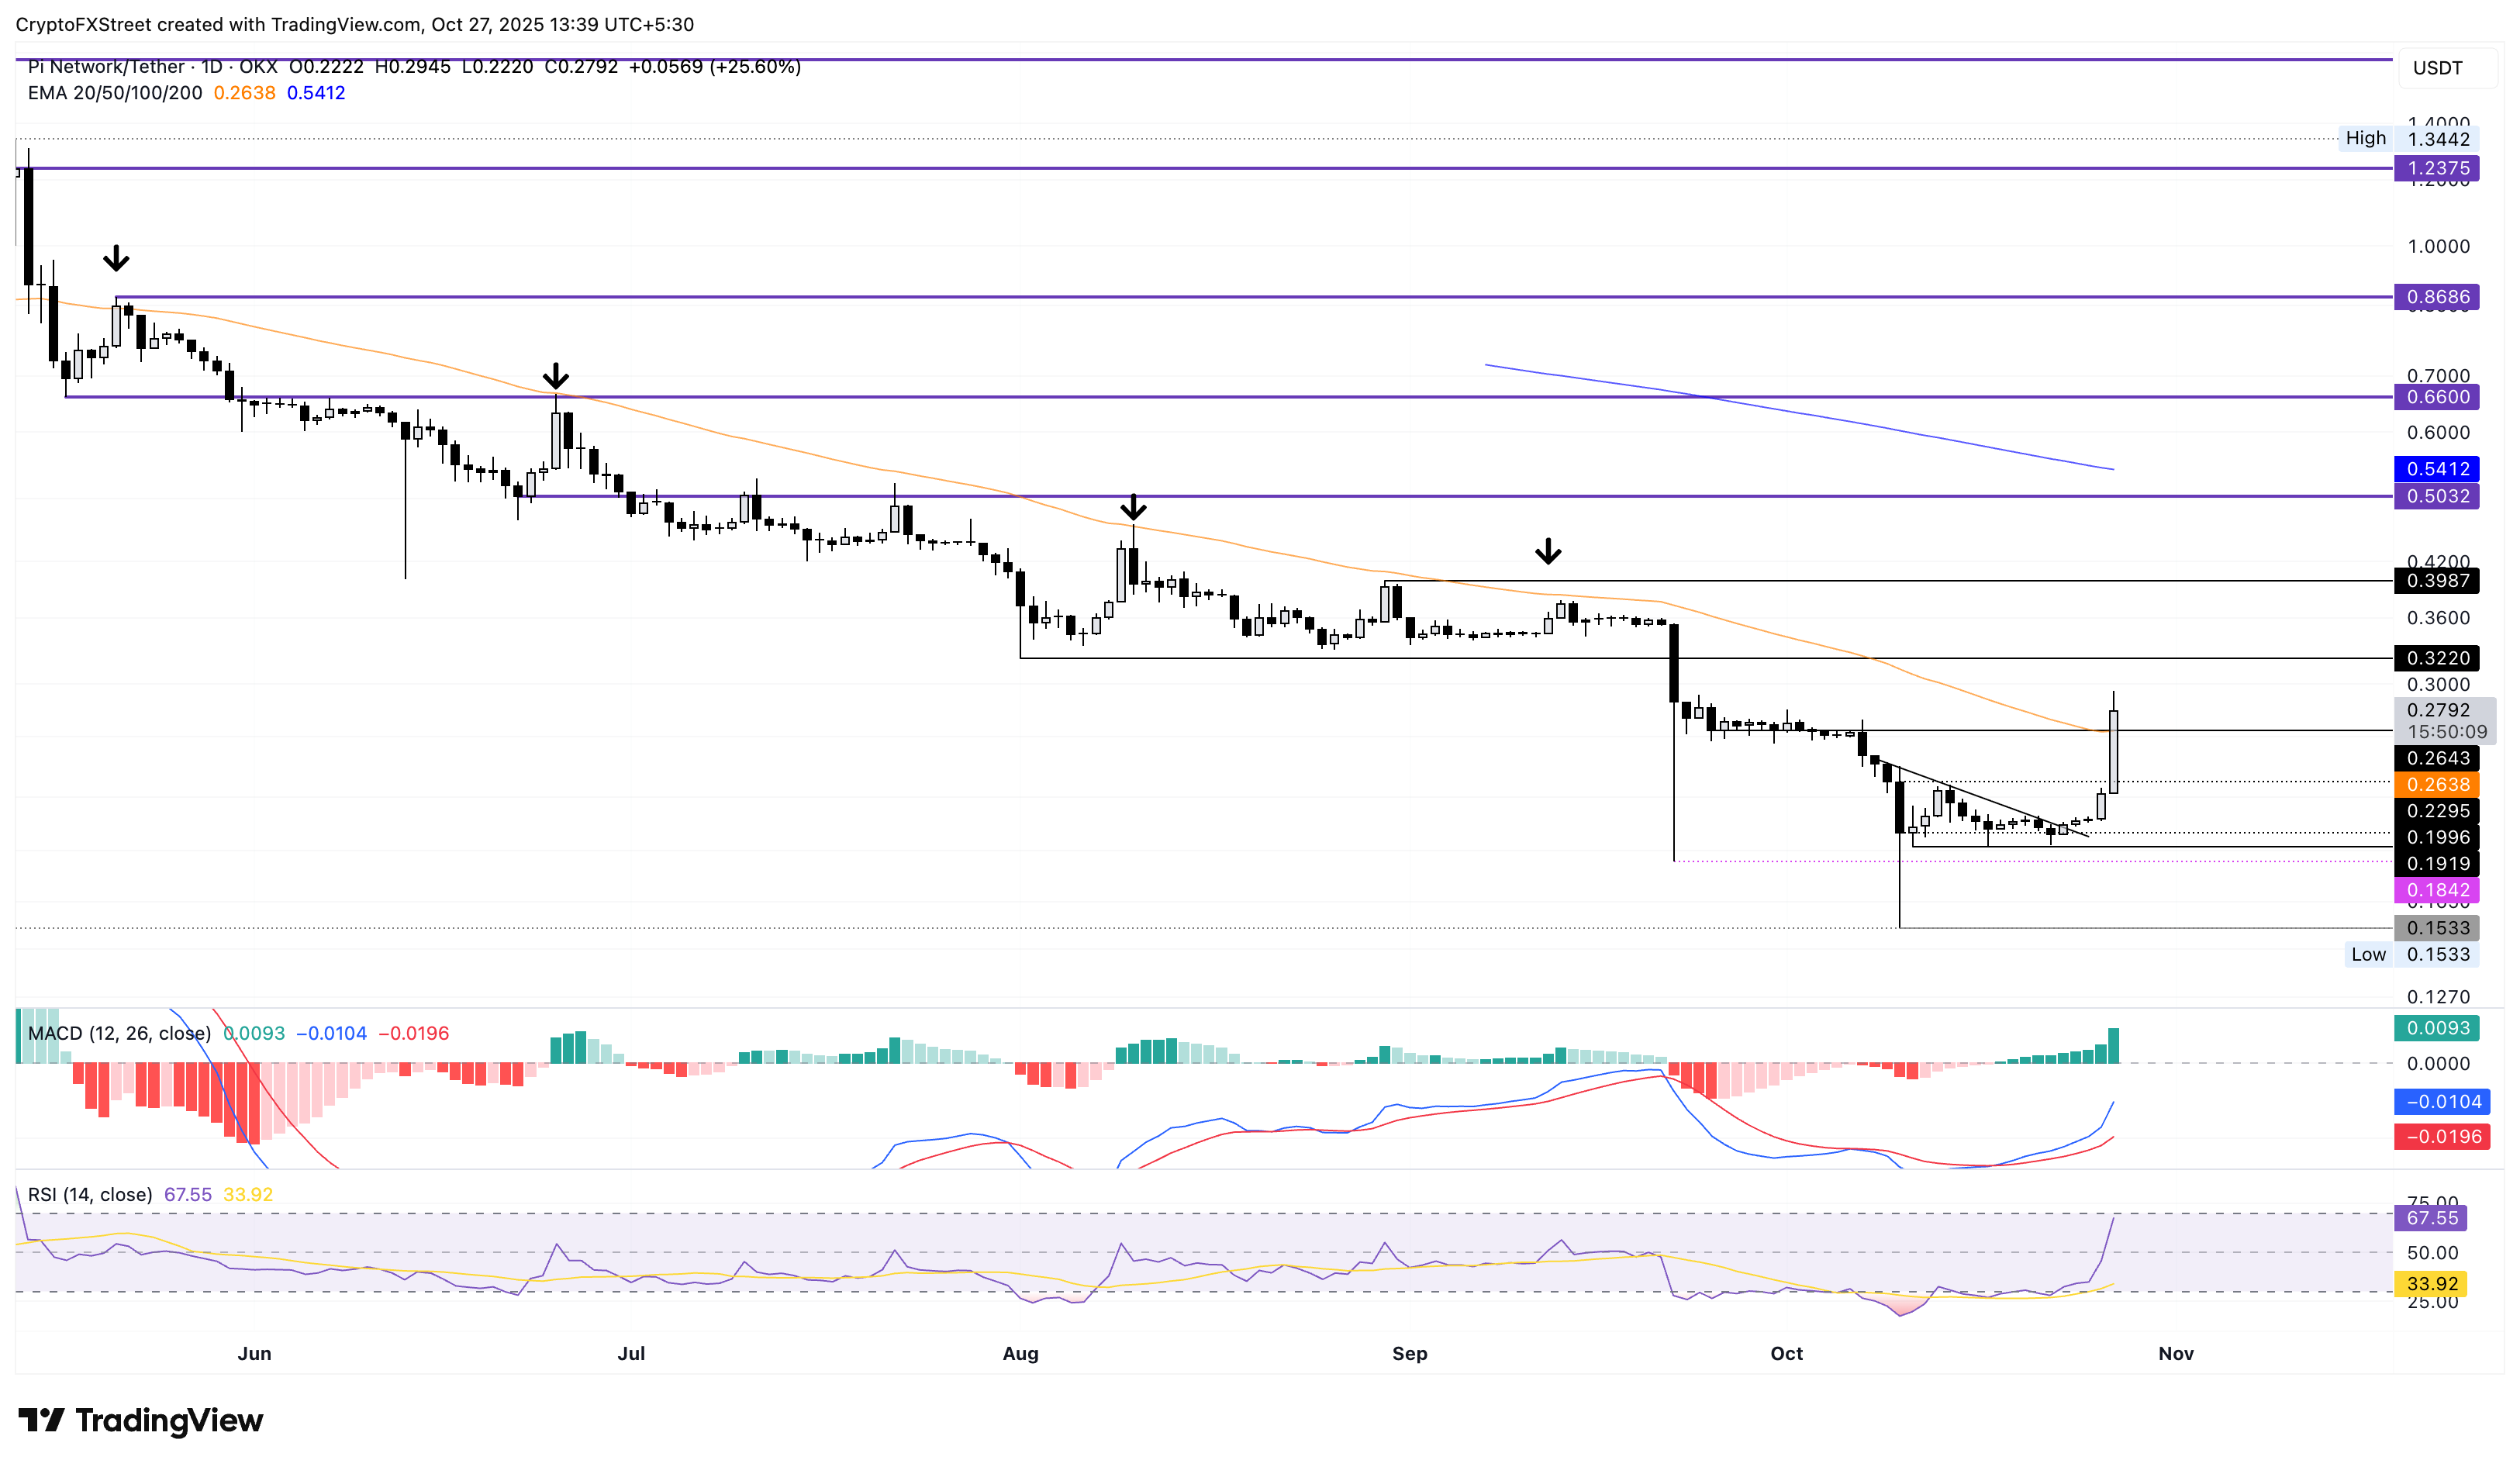
PI/USDT daily price chart.
If the PI token fails to hold above $0.2368, it could retest the $0.1919 support floor, marked by the October 11 low.
Cryptocurrency prices FAQs
Token launches influence demand and adoption among market participants. Listings on crypto exchanges deepen the liquidity for an asset and add new participants to an asset’s network. This is typically bullish for a digital asset.
A hack is an event in which an attacker captures a large volume of the asset from a DeFi bridge or hot wallet of an exchange or any other crypto platform via exploits, bugs or other methods. The exploiter then transfers these tokens out of the exchange platforms to ultimately sell or swap the assets for other cryptocurrencies or stablecoins. Such events often involve an en masse panic triggering a sell-off in the affected assets.
Macroeconomic events like the US Federal Reserve’s decision on interest rates influence crypto assets mainly through the direct impact they have on the US Dollar. An increase in interest rate typically negatively influences Bitcoin and altcoin prices, and vice versa. If the US Dollar index declines, risk assets and associated leverage for trading gets cheaper, in turn driving crypto prices higher.
Halvings are typically considered bullish events as they slash the block reward in half for miners, constricting the supply of the asset. At consistent demand if the supply reduces, the asset’s price climbs.

FXStreet
Über eine Million Nutzer verlassen sich auf FXStreet für Echtzeit-Marktdaten, Charting-Tools, Experteneinblicke und Forex-News. Der umfassende Wirtschaftskalender und die Bildungs-Webinare helfen Tradern, informiert zu bleiben und fundierte Entscheidungen zu treffen. FXStreet wird von einem Team von rund 60 Fachleuten getragen, verteilt auf den Hauptsitz in Barcelona und verschiedene Regionen weltweit.
Read More


