
Trade The World
USD/CAD Price Forecast: Eyes fresh six-month highs near 1.4150 within overbought zone
Von Akhtar Faruqui
Veröffentlichungsdatum: 7 Nov 2025 | Änderungsdatum: 7 Nov 2025


POPULAR ARTICLES

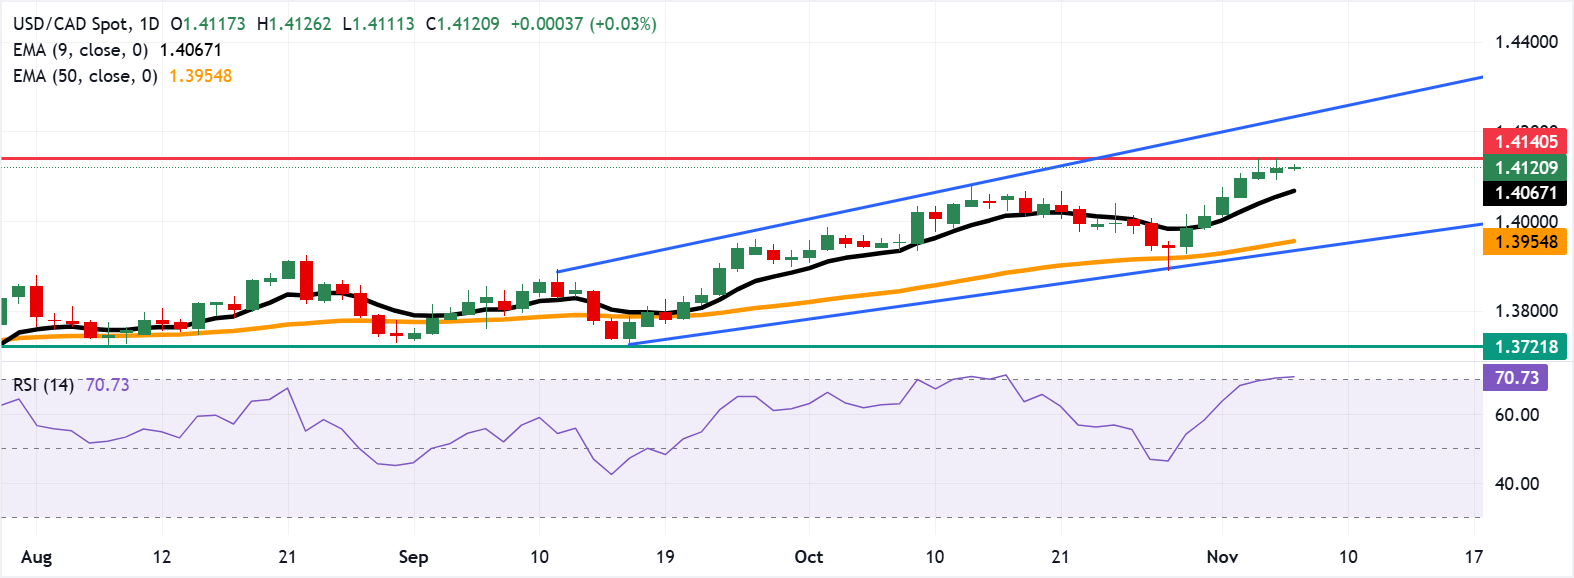
USD/CAD continues its winning streak for the seventh consecutive day, trading around 1.4120 during the European hours on Friday. The technical analysis of the daily chart indicates a prevailing bullish bias, with the pair remaining within the ascending channel pattern.
- USD/CAD may test the fresh seven-month high of 1.4140.
- The 14-day Relative Strength Index sits at 70, indicating an overbought territory.
- The immediate support appears at the psychological level of 1.4100.
USD/CAD continues its winning streak for the seventh consecutive day, trading around 1.4120 during the European hours on Friday. The technical analysis of the daily chart indicates a prevailing bullish bias, with the pair remaining within the ascending channel pattern.
The short-term price momentum is stronger as the pair rises above the nine-day Exponential Moving Average (EMA). However, the 14-day Relative Strength Index (RSI) is positioned at the 70 level, suggesting a stronger bullish bias but lies within the overbought territory and a potential near-term downward correction.
The USD/CAD pair may test the fresh seven-month high of 1.4140, reached on November 5. A break above this level would support the pair to explore the area around the upper boundary of the ascending channel at 1.4230.
On the downside, the primary support lies at the psychological level of 1.4100, followed by the nine-day EMA of 1.4067. Further declines below this level would dampen the short-term price momentum and prompt the USD/CAD pair to test the 50-day EMA at 1.3954, followed by the ascending channel’s lower boundary around 1.3940.
Canadian Dollar Price Today
The table below shows the percentage change of Canadian Dollar (CAD) against listed major currencies today. Canadian Dollar was the weakest against the Australian Dollar.
| USD | EUR | GBP | JPY | CAD | AUD | NZD | CHF | |
|---|---|---|---|---|---|---|---|---|
| USD | 0.13% | 0.12% | 0.29% | 0.03% | -0.07% | 0.30% | 0.19% | |
| EUR | -0.13% | -0.01% | 0.16% | -0.10% | -0.20% | 0.17% | 0.06% | |
| GBP | -0.12% | 0.00% | 0.16% | -0.12% | -0.19% | 0.18% | 0.07% | |
| JPY | -0.29% | -0.16% | -0.16% | -0.24% | -0.33% | 0.01% | -0.08% | |
| CAD | -0.03% | 0.10% | 0.12% | 0.24% | -0.10% | 0.25% | 0.17% | |
| AUD | 0.07% | 0.20% | 0.19% | 0.33% | 0.10% | 0.38% | 0.27% | |
| NZD | -0.30% | -0.17% | -0.18% | -0.01% | -0.25% | -0.38% | -0.11% | |
| CHF | -0.19% | -0.06% | -0.07% | 0.08% | -0.17% | -0.27% | 0.11% |
The heat map shows percentage changes of major currencies against each other. The base currency is picked from the left column, while the quote currency is picked from the top row. For example, if you pick the Canadian Dollar from the left column and move along the horizontal line to the US Dollar, the percentage change displayed in the box will represent CAD (base)/USD (quote).

FXStreet
Über eine Million Nutzer verlassen sich auf FXStreet für Echtzeit-Marktdaten, Charting-Tools, Experteneinblicke und Forex-News. Der umfassende Wirtschaftskalender und die Bildungs-Webinare helfen Tradern, informiert zu bleiben und fundierte Entscheidungen zu treffen. FXStreet wird von einem Team von rund 60 Fachleuten getragen, verteilt auf den Hauptsitz in Barcelona und verschiedene Regionen weltweit.
Read More


