
Trade The World
USD/CAD Price Forecast: Tests confluence support zone around 1.3800, nine-day EMA
Von Akhtar Faruqui
Veröffentlichungsdatum: 5 Sep 2025 | Änderungsdatum: 5 Sep 2025


POPULAR ARTICLES

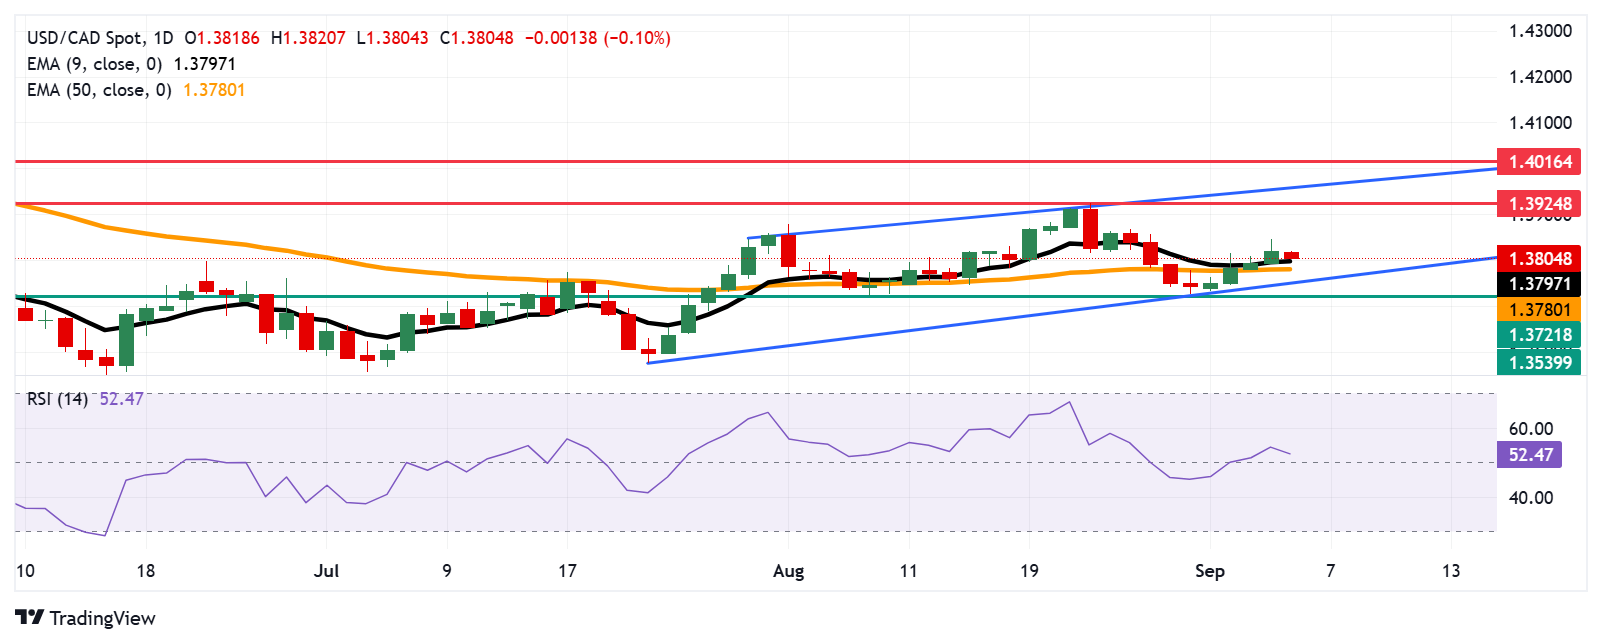
USD/CAD trades around 1.3810 during the Asian hours on Friday, halting its four-day winning streak. The technical analysis of the daily chart suggests that the pair moves sideways within an ascending channel pattern, indicating that market sentiment is bullish.
- USD/CAD may find the initial barrier at the four-month high of 1.3924.
- The market outlook is bullish as the 14-day RSI is positioned slightly above the 50 level.
- The pair is testing the 1.3800 support near the nine-day EMA of 1.3797.
USD/CAD trades around 1.3810 during the Asian hours on Friday, halting its four-day winning streak. The technical analysis of the daily chart suggests that the pair moves sideways within an ascending channel pattern, indicating that market sentiment is bullish.
The 14-day Relative Strength Index (RSI) is positioned slightly above the 50 level, indicating a bullish bias is active. Additionally, the USD/CAD pair has moved above the nine-day Exponential Moving Average (EMA), suggesting the short-term price momentum is strengthening.
On the upside, the USD/CAD pair may explore the region around the four-month high at 1.3924, which was recorded on August 22, followed by the upper boundary of the ascending channel around 1.3960. A break above this crucial resistance zone would strengthen the bullish bias and support the pair to test the five-month high at 1.4016, which was reached on May 13.
The USD/CAD pair is testing its immediate support at the psychological level of 1.3800, aligned with the nine-day EMA of 1.3797 and followed by the 50-day EMA of 1.3780. A break below these levels would weaken the short- and medium-term price momentum and prompt the pair to test the ascending channel’s lower boundary around 1.3750, followed by the two-month low of 1.3721, which was recorded on August 7.
USD/CAD: Daily Chart
Canadian Dollar Price Today
The table below shows the percentage change of Canadian Dollar (CAD) against listed major currencies today. Canadian Dollar was the weakest against the New Zealand Dollar.
| USD | EUR | GBP | JPY | CAD | AUD | NZD | CHF | |
|---|---|---|---|---|---|---|---|---|
| USD | -0.19% | -0.17% | -0.12% | -0.11% | -0.34% | -0.35% | -0.18% | |
| EUR | 0.19% | 0.04% | -0.03% | 0.08% | -0.07% | -0.14% | 0.02% | |
| GBP | 0.17% | -0.04% | -0.02% | 0.04% | -0.09% | -0.19% | 0.02% | |
| JPY | 0.12% | 0.03% | 0.02% | 0.07% | -0.15% | -0.19% | 0.12% | |
| CAD | 0.11% | -0.08% | -0.04% | -0.07% | -0.18% | -0.24% | -0.04% | |
| AUD | 0.34% | 0.07% | 0.09% | 0.15% | 0.18% | -0.10% | 0.12% | |
| NZD | 0.35% | 0.14% | 0.19% | 0.19% | 0.24% | 0.10% | 0.20% | |
| CHF | 0.18% | -0.02% | -0.02% | -0.12% | 0.04% | -0.12% | -0.20% |
The heat map shows percentage changes of major currencies against each other. The base currency is picked from the left column, while the quote currency is picked from the top row. For example, if you pick the Canadian Dollar from the left column and move along the horizontal line to the US Dollar, the percentage change displayed in the box will represent CAD (base)/USD (quote).

FXStreet
Über eine Million Nutzer verlassen sich auf FXStreet für Echtzeit-Marktdaten, Charting-Tools, Experteneinblicke und Forex-News. Der umfassende Wirtschaftskalender und die Bildungs-Webinare helfen Tradern, informiert zu bleiben und fundierte Entscheidungen zu treffen. FXStreet wird von einem Team von rund 60 Fachleuten getragen, verteilt auf den Hauptsitz in Barcelona und verschiedene Regionen weltweit.
Read More


