
Trade The World
USD/CHF Price Forecasts: Dollar recovery stalls at the 0.8080 previous support
Von Guillermo Alcala
Veröffentlichungsdatum: 7 Nov 2025 | Änderungsdatum: 7 Nov 2025


POPULAR ARTICLES

The US Dollar is faring better than the Swiss Franc amid the cautious market mood on Friday.
- The US Dollar trims losses against the Swissie but remains capped below 0.8080.
- A cautious market mood is supporting the safe-haven Dollar as concerns about an AI bubble increase.
- Technically, an "evening star" candle pattern supports the view of a deeper Dollar correction.
The US Dollar is faring better than the Swiss Franc amid the cautious market mood on Friday. The pair has managed to trim some losses but is struggling to rise above the 0.8080 previous support area during its recovery attempt from the 0.8057 lows.
The risk-averse market mood is underpinninfg the safe-haven US Dollar on Friday, as investors’ concerns about an AI bubble have sent US and Asian equity markets tumbling in a negative trend that has extended into the European session.
Technical Analysis: An evening star pattern suggests a deeper correction
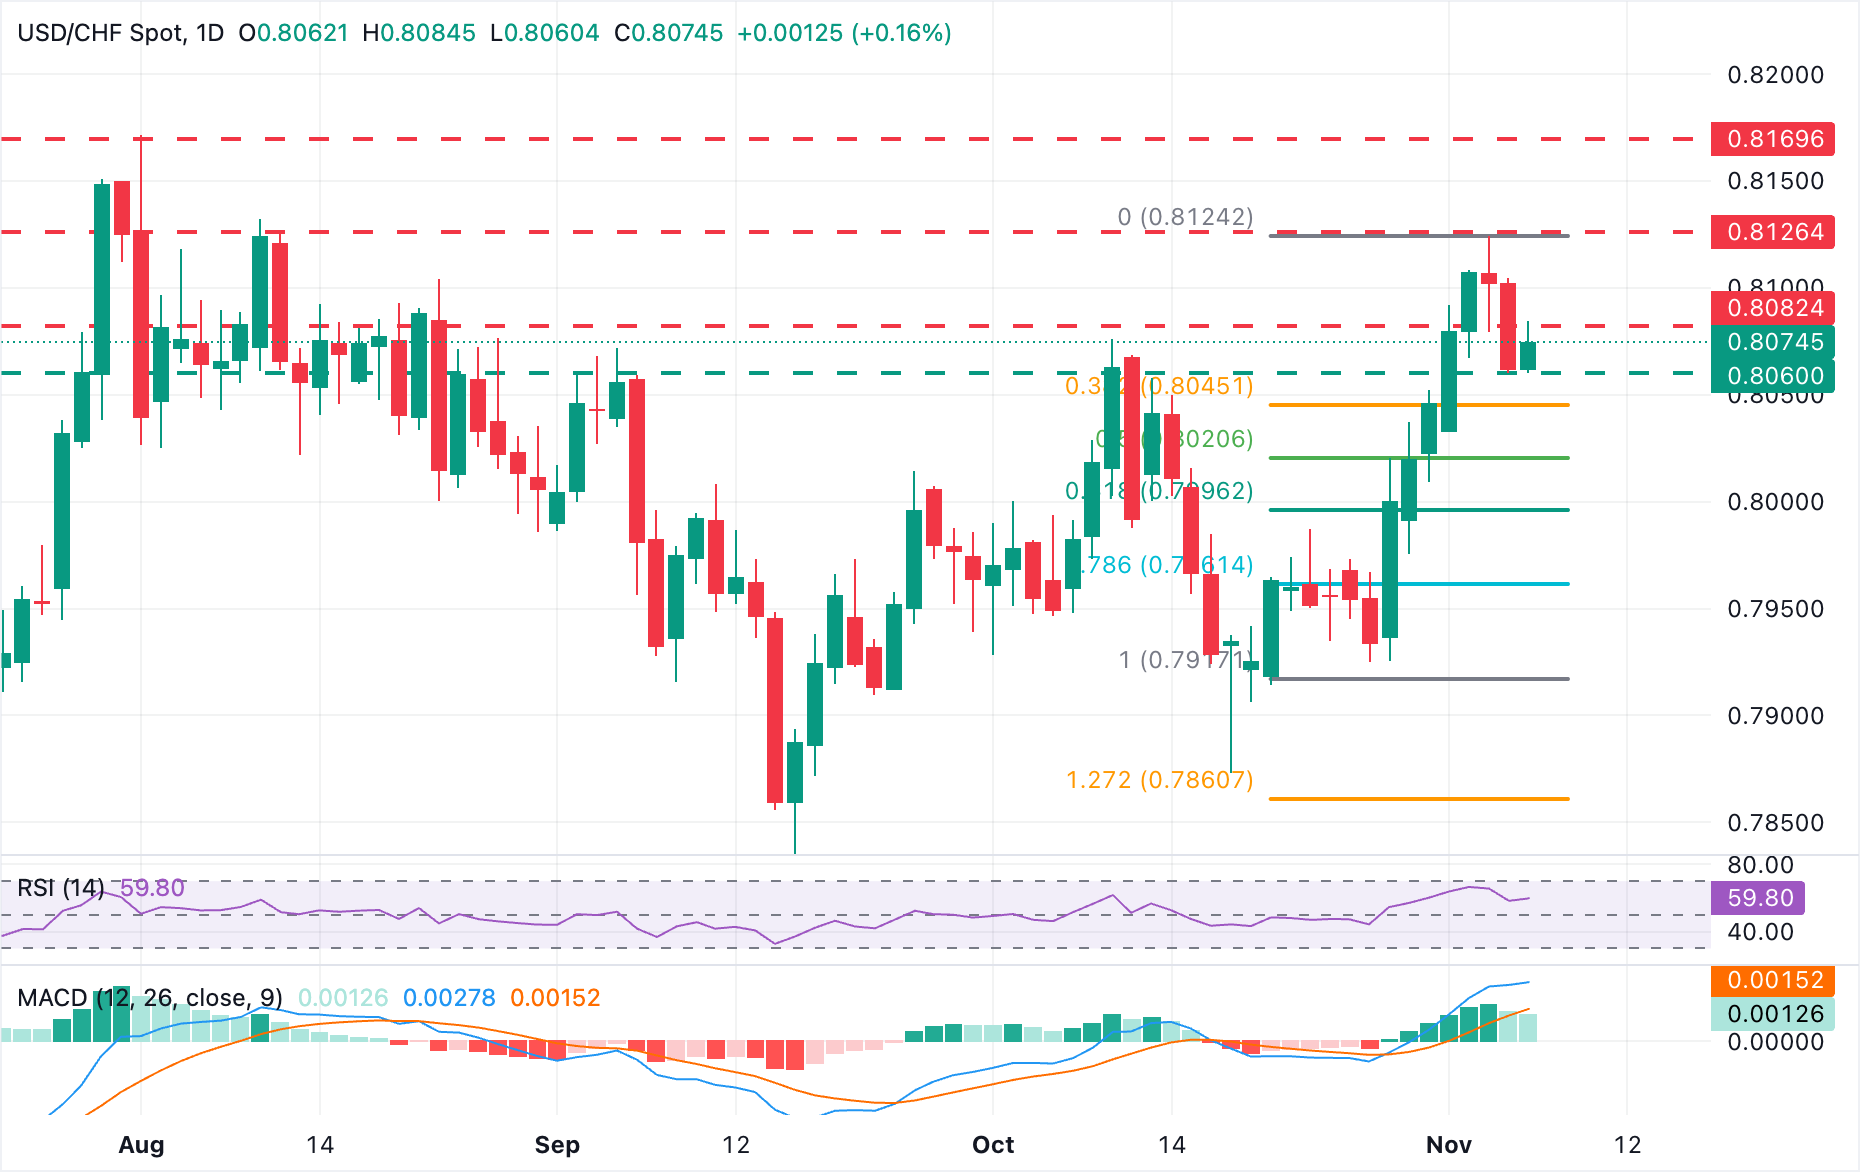
Momentum indicators in the 4-Hour chart suggest that the rebound from session lows remains frail. The Relative Strength Index (RSI) is flattening around the 50 line that divides positive from negative territory, and the Moving Average Convergence Divergence (MACD) shows a mild bearish trend.
A look at the daily chart reveals an “evening star” candle pattern, a formation that suggests an exhausting bull market. Bears, however, would need to break the 0.8060 daily low and the 38.2% Fibonacci retracement of last week’s bullish cycle, near 0.8045. Further down, the 61.8% Fibonacci retracement at the 0.8000 psychological level emerges as a plausible target.
To the upside, a confirmation above the mentioned 0.8080 area would clear the path towards the November 5 high at 0.8125. Beyond here, August’s peak, at 0.8170, would come into focus.
US Dollar Price Today
The table below shows the percentage change of US Dollar (USD) against listed major currencies today. US Dollar was the strongest against the New Zealand Dollar.
| USD | EUR | GBP | JPY | CAD | AUD | NZD | CHF | |
|---|---|---|---|---|---|---|---|---|
| USD | 0.00% | 0.25% | 0.25% | -0.02% | -0.10% | 0.28% | 0.17% | |
| EUR | -0.01% | 0.24% | 0.27% | -0.03% | -0.11% | 0.26% | 0.15% | |
| GBP | -0.25% | -0.24% | 0.00% | -0.29% | -0.34% | 0.03% | -0.08% | |
| JPY | -0.25% | -0.27% | 0.00% | -0.23% | -0.33% | 0.03% | -0.07% | |
| CAD | 0.02% | 0.03% | 0.29% | 0.23% | -0.08% | 0.26% | 0.18% | |
| AUD | 0.10% | 0.11% | 0.34% | 0.33% | 0.08% | 0.38% | 0.27% | |
| NZD | -0.28% | -0.26% | -0.03% | -0.03% | -0.26% | -0.38% | -0.11% | |
| CHF | -0.17% | -0.15% | 0.08% | 0.07% | -0.18% | -0.27% | 0.11% |
The heat map shows percentage changes of major currencies against each other. The base currency is picked from the left column, while the quote currency is picked from the top row. For example, if you pick the US Dollar from the left column and move along the horizontal line to the Japanese Yen, the percentage change displayed in the box will represent USD (base)/JPY (quote).
,

FXStreet
Über eine Million Nutzer verlassen sich auf FXStreet für Echtzeit-Marktdaten, Charting-Tools, Experteneinblicke und Forex-News. Der umfassende Wirtschaftskalender und die Bildungs-Webinare helfen Tradern, informiert zu bleiben und fundierte Entscheidungen zu treffen. FXStreet wird von einem Team von rund 60 Fachleuten getragen, verteilt auf den Hauptsitz in Barcelona und verschiedene Regionen weltweit.
Read More


