


Introduction
Price action is the analysis to read trend, and act on repeatable formations through various trading strategies like trend following, breakout trading, and reversal trading.
What Is Price Action in Trading?
Price action is the study of how price moves from one level to another and how that movement reflects control between buyers and sellers. In practice, technical analysis traders read swing highs, swing lows, candle closes, rejection wicks, and breakout behavior to decide whether a market is trending, ranging, accelerating, or failing.
The reason many traders start with price action is simple. Price is the source data. Most indicators are derived from price, which means they process information that has already happened rather than reading the auction directly.
That does not mean price action is magical or predictive on its own. Its edge comes from reading context well, waiting for location, and managing risk with discipline. A bullish engulfing candle in the middle of random noise means far less than the same candle at support inside a higher time frame uptrend.
In practical terms, traders use price action to do three things. They identify the market condition, define where a trade idea makes sense, and choose a trigger for entry, stop loss, and target.
What Is Naked Trading and Why Do Traders Use It?
Naked trading is a style of price action trading that removes most or all indicators from the chart and focuses on price, structure, and levels. The chart is kept visually clean so the trader can read trend, rejection, and breakout behavior without signal overload.
The main benefit is simplicity. A cleaner chart reduces hesitation, lowers analysis paralysis, and forces the trader to answer the only questions that matter first. Is the market trending or ranging, where is the key level, and what is price doing there?
This also improves decision speed. When the setup is obvious, the trader does not have to reconcile five conflicting indicators before acting. That matters in fast markets where hesitation turns a planned entry into a late entry with poor reward to risk.
Another benefit is better signal quality. Many traders discover that more tools do not create more clarity, instead they create more reasons to overfit weak setups.
Important: Naked trading does not mean trading without rules; it means using fewer tools while applying stricter context and execution rules.
The limitation is subjectivity. A stripped chart can be powerful in skilled hands, but two traders can read the same pattern differently. That is why serious price action traders still need fixed rules for structure, entry confirmation, stop placement, and invalidation.
What Are the Core Components of Price Action Analysis?
The first core component is trend identification. Price action traders often read the sequence of highs and lows to define market structure. A market making higher highs and higher lows is bullish, while a market making lower highs and lower lows is bearish.
The second core component is support and resistance. These are the areas where price has previously stalled, reversed, or broken with force. Professional traders treat them as zones, not exact lines, because prices often fake out on a level before choosing direction.
The third core component is chart patterns. These patterns show how price compresses, expands, fails, or reverses. A pattern matters because it gives structure to analyzing trader behavior.
The fourth core component is candlestick patterns. Candles reveal rejection, continuation, exhaustion, and momentum in a compact format. The close, wick length, and body size all matter because they show where control ended when the bar closed.
A strong price action read comes from combining these components. Trend gives bias, support and resistance gives location, and the candle or pattern gives timing.
Which Candlestick and Chart Patterns Should Traders Learn First?
Engulfing Candlestick
A bullish or bearish engulfing candle shows a dramatic shift in control. It is most useful after a pullback into a key level, not in the middle of a random range.Double Top and Double Bottom
A double top candlestick can signal failed upside continuation, while a double bottom can signal failed downside continuation. The critical detail is confirmation. The pattern becomes more meaningful when the neckline breaks or when the second test shows weaker opposing momentum.Pin Bar Candlestick
A pin bar candlestick shows strong rejection of a price level through a long wick and relatively small body. It works best when the wick rejects a clear support or resistance zone and the entry aligns with the broader structure.Marubozu Candlestick
A marubozu candle is a strong momentum candle with little or no wick. It often appears during clean breakouts or powerful continuation moves, but traders should be careful not to chase it after the expansion is already stretched.
Remember, a pattern is only useful when it appears where trading volume is likely to matter.
How do Traders Use Price Action in Trading?
A basic price action trade can start with nothing more than a clear pattern and a clear invalidation point.
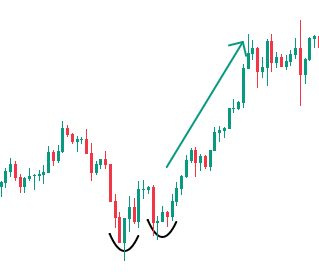
In this example using a real USDJPY daily chart starting around November 2022. This example shows how price action trading works in its simplest form. The trader reads repeated rejection at the same area, waits for confirmation, and builds the trade around structure rather than indicators.
Initially, price sells off, forms a first low, rebounds, then returns to that area and prints a second low near the same level. That creates a double bottom, which shows that sellers tested the low twice but could not push the market into fresh downside continuation.
Using only the pattern you could wait for price to break above the swing high between the two lows, which acts as the confirmation point. That approach is cleaner than buying the second low blindly because it waits for price to prove that the reversal is actually starting. The stop loss would usually sit below the second bottom, while the target would be the next obvious swing high.
The limitation is that the pattern alone says little about whether major resistance is sitting directly overhead, which affects how much room the trade has to expand.
How Do Traders Use Price Action and Confluence in the Same Setup? (how-do-traders-use-price-action-and-confluence-in-the-same-setup)
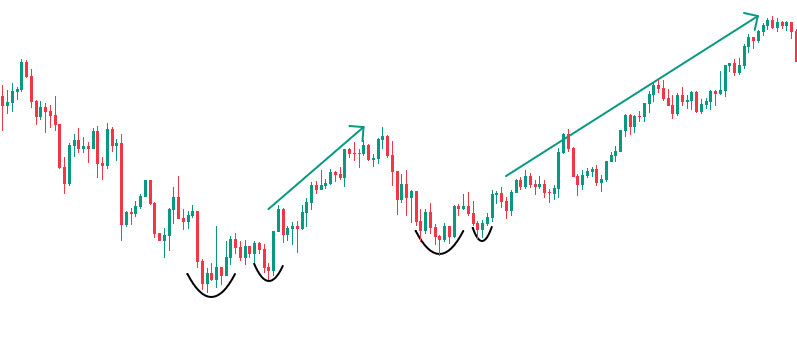
The same USDJPY daily chart becomes much stronger once support and resistance are added to the analysis. Price first rallies into a major horizontal resistance, then later breaks above it.
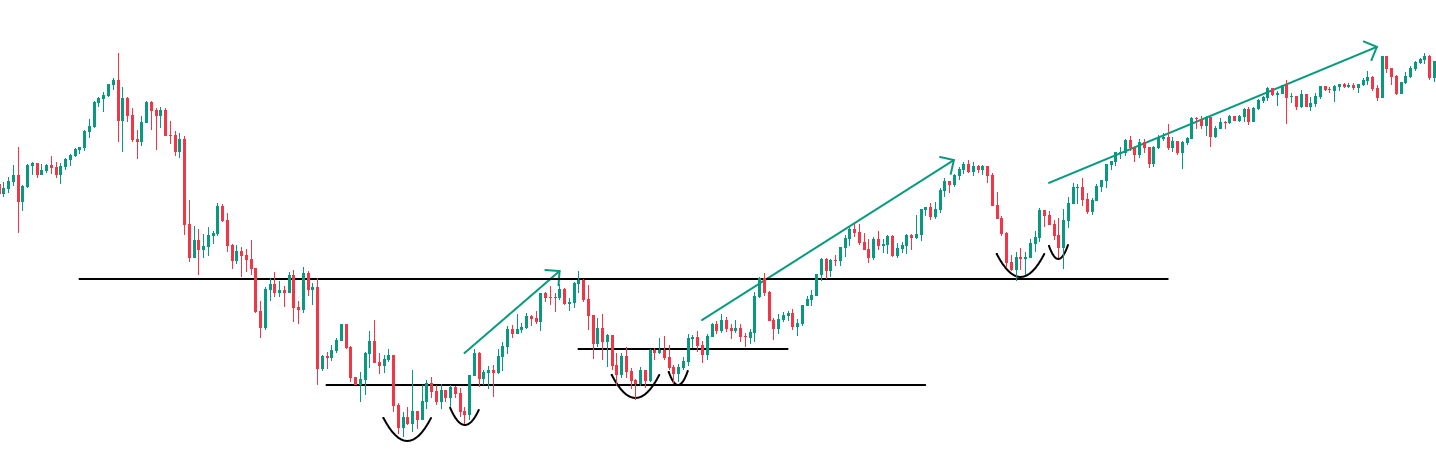
That breakout gives the trader an important level to carry forward, because in trending markets, old resistance often becomes new support when price comes back to retest it.
When price pulls back into that flipped support zone and then forms another double bottom, the setup has real confluence. The trader is no longer buying the pattern in isolation. The trader is buying a pattern that appears exactly where buyers were already expected to defend.
That is what makes this example better than the first one. You can identify the next area of interest before the trade appears, then wait for the double bottom to confirm that the level is holding. Entry can come on the break above the local swing high, the stop can sit below the second low and support zone, and the upside target can be the next swing high in the continuation move.
This is the practical value of confluence in price action trading. It does not predict the exact candle in advance. It helps the trader define where a valid setup is more likely to matter, then wait for price to confirm it.
What is Price Action Strategy?
Most price action strategies fall into three categories, Trend Trading, Breakout Trading and Reversal Trading.
The setup logic changes, but the trading foundation remains the same, which is structure, location, trigger, and risk control.
1. Trend Following
This strategy trades in the direction of the existing market structure. Traders wait for pullbacks into support in an uptrend or resistance in a downtrend, then use a trigger such as a pin bar, engulfing candle, or strong continuation close.
The advantage is that the trader is moving with momentum rather than against it. The main risk is chasing a trend that is already extended, where the stop becomes wide and the next push has limited room.
2. Breakout Trading
This strategy trades when price escapes a range, consolidation, or key level with strength. The ideal breakout shows a decisive close outside the area, not just a wick through it.
Execution matters here. Breakouts around major news or session opens can produce heavy slippage and false expansion. Many experienced traders wait for either a strong close or a retest of the broken level before committing size.
3. Reversal Trading
This strategy looks for exhaustion at a major level and trades the reversal in trend. Common clues include failed breaks, sharp rejection wicks, double tops, double bottoms, and engulfing candles after a stretched move.
Reversal trading can offer excellent reward to risk, but it is also where many traders lose money. Trying to call every top and bottom without enough confirmation signals usually means fighting trend with weak evidence.
A continuation signal is strongest when it appears in a pullback to support inside a clear trend. The same signal is weaker when it forms near higher time frame resistance because the location works against further expansion. The pattern may be identical, but the context changes the trade.


