
Trade The World
GBP/JPY Price Forecast: Pound steadies at long-term highs above 212.20
By Guillermo Alcala
Date Published: 12 Jan 2026 | Date Modified: 12 Jan 2026


POPULAR ARTICLES

The Sterling stands comfortably at long-term highs above 212.10 on Monday, supported by a weaker Japanese Yen following news reporting that Prime Minister Sanae Takaichi might be considering calling snap elections in February.According to a Kyodo News report, Takaichi would have told an official of
- GBP/JPY hits fresh highs nearing 212.50 amid generalised Yen weakness.
- JPY tumbles across the board as PM Takaichi mulls snap elections.
- Technical indicators point to further appreciation towards 212.85 or 213.34.
The Sterling stands comfortably at long-term highs above 212.10 on Monday, supported by a weaker Japanese Yen following news reporting that Prime Minister Sanae Takaichi might be considering calling snap elections in February.
According to a Kyodo News report, Takaichi would have told an official of the ruling Liberal Democratic Party (LDP) that she is considering dissolving the House of Representatives on January 23 and calling a snap election for February 8 or 15.
The news took markets by surprise, triggering fresh concerns about the consequences of another period of political uncertainty, which has sent the Yen dropping across the board.
Technical Analysis: Next bullish targets are 212.85 and 213.34
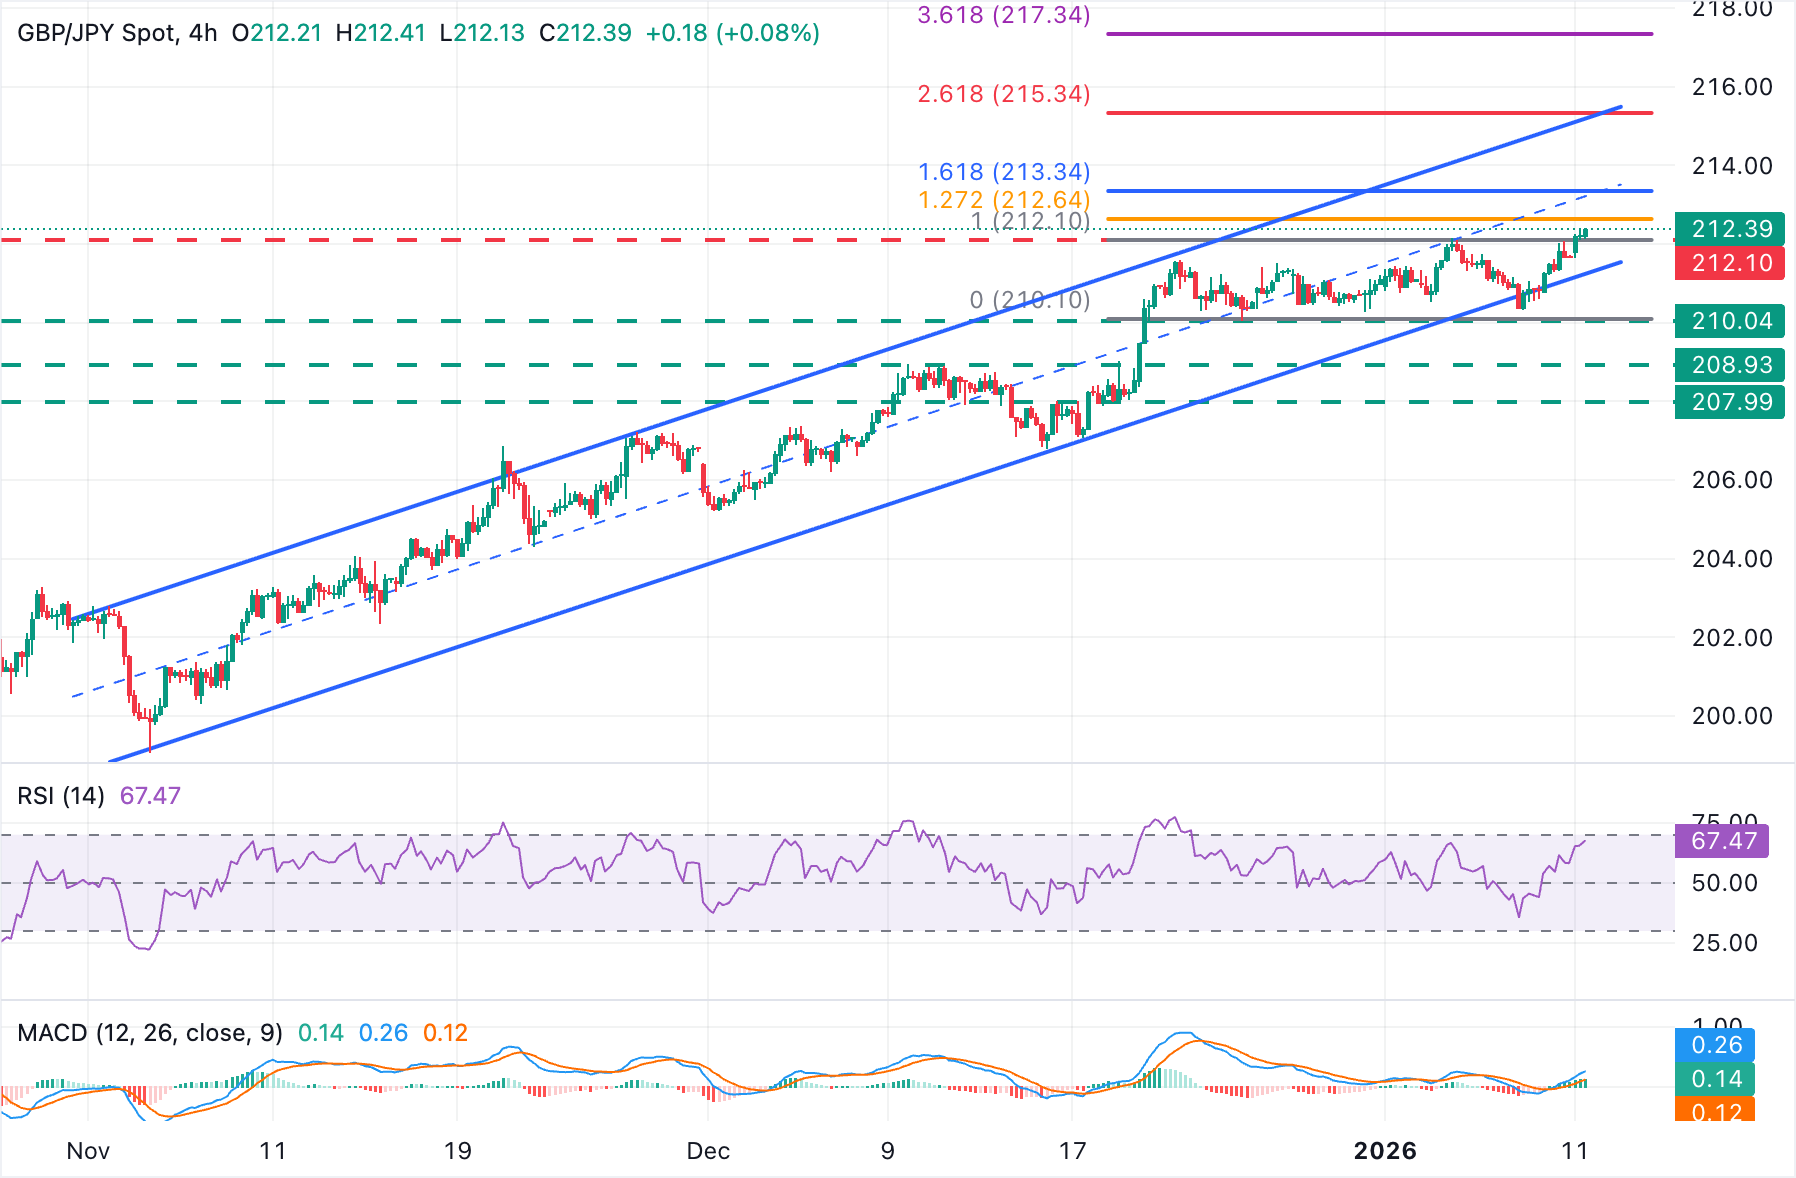
GBP/JPY trades at 212.29. moving within an ascending channel from early November lows. Technical indicators are pointing higher. The 4-Hour Relative Strength Index (RSI) at 66 signals a firm bullish tone without overbought conditions. The Moving Average Convergence Divergence (MACD) line stands above the Signal line, and the histogram widens within positive territory, suggesting strengthening momentum.
If the pair manages to consolidate above the previous long-term high, at 212.10, bulls will aim for the 127.2% Fibonacci extension of the last two weeks' trading range, at 212.85. The 161.8% extension of the mentioned cycle is at 213.34.
A bearish reversal below the mentioned 210 brings the trendline resistance, now at 211.20, into focus. Further down, key support is at the late-December lows, between 210.05 and 210.25.
(The technical analysis of this story was written with the help of an AI tool.)
Japanese Yen Price Today
The table below shows the percentage change of Japanese Yen (JPY) against listed major currencies today. Japanese Yen was the strongest against the US Dollar.
| USD | EUR | GBP | JPY | CAD | AUD | NZD | CHF | |
|---|---|---|---|---|---|---|---|---|
| USD | -0.50% | -0.43% | -0.08% | -0.27% | -0.33% | -0.44% | -0.60% | |
| EUR | 0.50% | 0.07% | 0.39% | 0.23% | 0.18% | 0.06% | -0.09% | |
| GBP | 0.43% | -0.07% | 0.34% | 0.16% | 0.11% | -0.02% | -0.17% | |
| JPY | 0.08% | -0.39% | -0.34% | -0.18% | -0.24% | -0.34% | -0.49% | |
| CAD | 0.27% | -0.23% | -0.16% | 0.18% | -0.06% | -0.17% | -0.32% | |
| AUD | 0.33% | -0.18% | -0.11% | 0.24% | 0.06% | -0.12% | -0.30% | |
| NZD | 0.44% | -0.06% | 0.02% | 0.34% | 0.17% | 0.12% | -0.15% | |
| CHF | 0.60% | 0.09% | 0.17% | 0.49% | 0.32% | 0.30% | 0.15% |
The heat map shows percentage changes of major currencies against each other. The base currency is picked from the left column, while the quote currency is picked from the top row. For example, if you pick the Japanese Yen from the left column and move along the horizontal line to the US Dollar, the percentage change displayed in the box will represent JPY (base)/USD (quote).

Acuity Trading
Acuity Trading is a London-based fintech company founded in 2013 that specializes in AI-powered alternative data and sentiment analysis for trading and investments. They revolutionized the online trading experience by introducing visual news and sentiment tools, and today they continue to lead the fintech market with alpha-generating alternative data and highly engaging trading tools using the latest AI research and technology.
Read More


