
AUD/USD slips as Iran tensions lift US Dollar, hurt sentiment
By Christian Borjon Valencia
Updated: 21 Apr 2026


POPULAR ARTICLES

The Australian Dollar retreats during the North American session, down more than 0.30%. High tensions in the Middle East, spurred by Iran’s decision not to attend talks with the US in Pakistan. At the time of writing, the AUD/USD trades at 0.7153 after hitting a daily high of 0.7185.
- Risk aversion boosted the US Dollar after Iran skipped Pakistan talks.
- Strong US Retail Sales and labor data added pressure on the Aussie.
- Hawkish RBA expectations helped limit losses despite worsening market sentiment.
The Australian Dollar retreats during the North American session, down more than 0.30%. High tensions in the Middle East, spurred by Iran’s decision not to attend talks with the US in Pakistan. At the time of writing, the AUD/USD trades at 0.7153 after hitting a daily high of 0.7185.
Aussie weakens despite hawkish RBA bets and sparse local data
Sentiment soured, boosting the Greenback amid its safe-haven appeal. Pakistan’s efforts to bring Tehran to the table failed. At the same time, the US President Donald Trump attempts a Hail Mary, extending the ceasefire until Iranian authorities “can come up with a unified proposal.” He emphasized that the US blockade in the Strait of Hormuz would remain.
Newswires revealed that Iranian authorities do not recognize Trump’s ceasefire, via Iranian TV, and that they may not abide by it and act in accordance with national interests.
In the US, Retail Sales surprised to the upside, increasing 1.7% MoM in March from 0.7%, driven by higher gasoline prices and tax refund-related spending, while annual growth held at 4%. Meanwhile, the ADP Employment Change 4-week average rose to 54.8K from 39K, reinforcing the strength of the labor market.
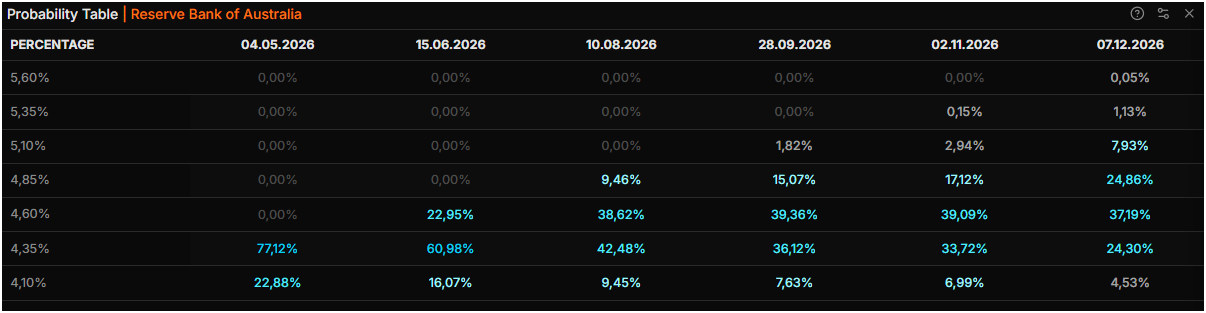
On the Australian front, the economic docket would remain scarce, yet the Reserve Bank of Australia (RBA) Deputy Governor Andrew Hauser said they’re focused on preventing a jump in medium-term inflation expectations. This increased expectations for further tightening by the RBA, with 77% odds of a rate hike at the May 4 meeting and another increase seen at the September 28 meeting, revealed Prime Terminal data.
RBA Interest Rates Table
On Wednesday, the US economic docket is absent, but it would get traction on Thursday with the release of Initial Jobless Claims for the week ending April 18 and S&P Global Flash PMIs.
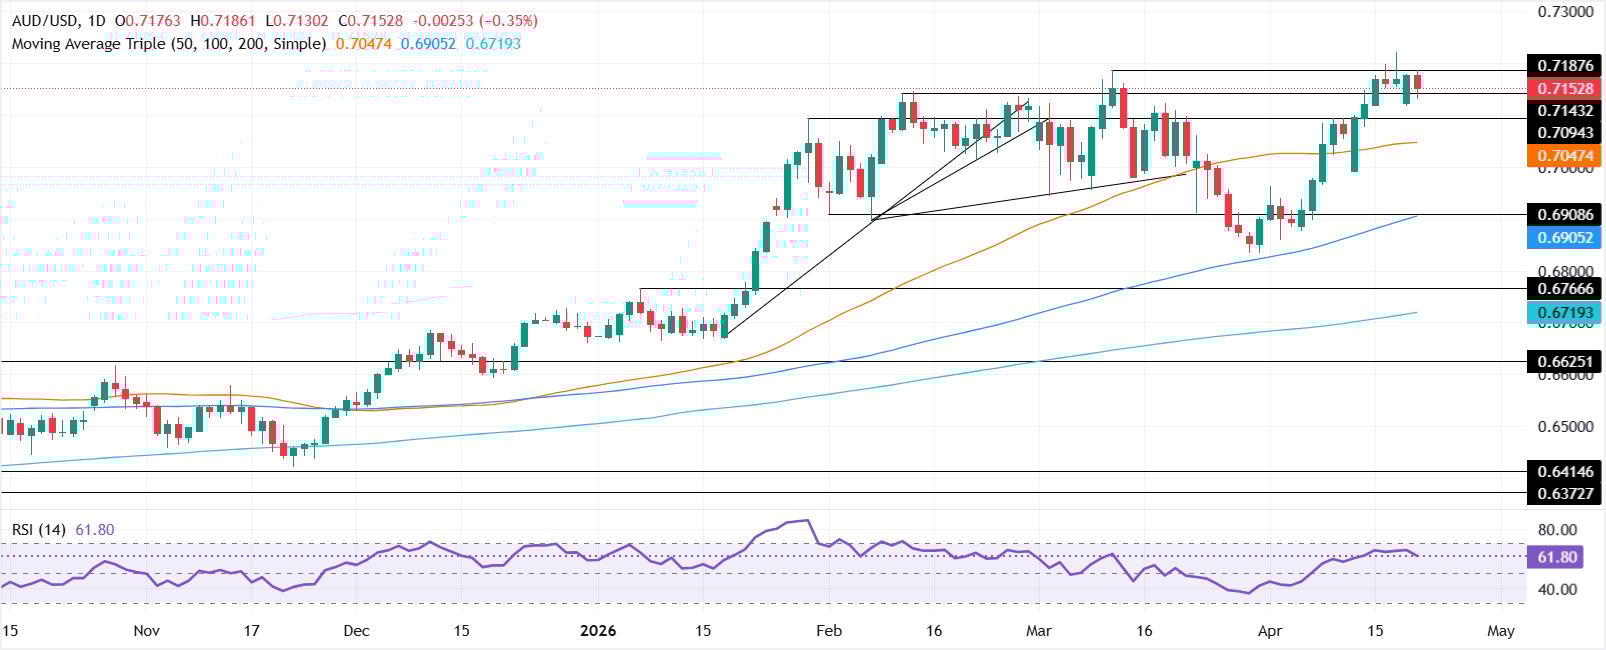
AUD/USD Price Analysis: Technical outlook
From a technical perspective, the AUD/USD uptrend stalled around 0.7180, pushing the pair towards 0.7150. Although momentum remains constructive, with the pair registering successive series of higher highs and higher lows, the Relative Strength Index (RSI) has begun to turn south, an indication that further consolidation lies ahead.
If AUD/USD stays above the April 21 low of 0.7129, a test of the 0.7187, the March 11 peak, is on the cards. Beyond that level, the next area of interest is the yearly peak at 0.7221, the April 17 cycle high.
On the other hand, if AU/USD tumbles below 0.7100, the next area of interest would be the 50-day Simple Moving Average (SMA) at 0.7046.
Australian Dollar Price This week
The table below shows the percentage change of Australian Dollar (AUD) against listed major currencies this week. Australian Dollar was the strongest against the Japanese Yen.
| USD | EUR | GBP | JPY | CAD | AUD | NZD | CHF | |
|---|---|---|---|---|---|---|---|---|
| USD | -0.03% | -0.12% | 0.35% | -0.17% | -0.40% | -0.55% | -0.07% | |
| EUR | 0.03% | -0.08% | 0.37% | -0.11% | -0.34% | -0.54% | -0.04% | |
| GBP | 0.12% | 0.08% | 0.47% | -0.03% | -0.26% | -0.44% | 0.04% | |
| JPY | -0.35% | -0.37% | -0.47% | -0.53% | -0.70% | -0.90% | -0.41% | |
| CAD | 0.17% | 0.11% | 0.03% | 0.53% | -0.13% | -0.37% | 0.09% | |
| AUD | 0.40% | 0.34% | 0.26% | 0.70% | 0.13% | -0.12% | 0.32% | |
| NZD | 0.55% | 0.54% | 0.44% | 0.90% | 0.37% | 0.12% | 0.45% | |
| CHF | 0.07% | 0.04% | -0.04% | 0.41% | -0.09% | -0.32% | -0.45% |
The heat map shows percentage changes of major currencies against each other. The base currency is picked from the left column, while the quote currency is picked from the top row. For example, if you pick the Australian Dollar from the left column and move along the horizontal line to the US Dollar, the percentage change displayed in the box will represent AUD (base)/USD (quote).

More than a million users rely on FXStreet for real-time market data, charting tools, expert insights, and forex news. Its comprehensive economic calendar and educational webinars help traders stay informed and make calculated decisions. FXStreet is supported by a team of about 60 professionals, split between the Barcelona headquarters and various global regions.
Read More


