
News & AnalysisCareer

The Pound Sterling registers modest gains versus the Greenback as US inflation data in the producer side came below or aligned with estimates, revealing that the disinflation process continued. The GBP/USD trades at 1.3503, up 0.06%.
Data from the US has weakened the Greenback, as indicated by the US Dollar Index (DXY): the DXY, which tracks the performance of six currencies against the Greenback, is down 0.14% to 99.83.

The US Producer Price Index (PPI) in July ticked lower from 5.5% to 4.7% YoY, below forecasts of 4.9%. Core figures, which exclude volatile items, decreased as expected from 4.7% to 4.2% YoY. At the same time, the US Department of Labor revealed that Initial Jobless Claims for the week ending August 8 rose from 200K to 208K, above estimates of 202K
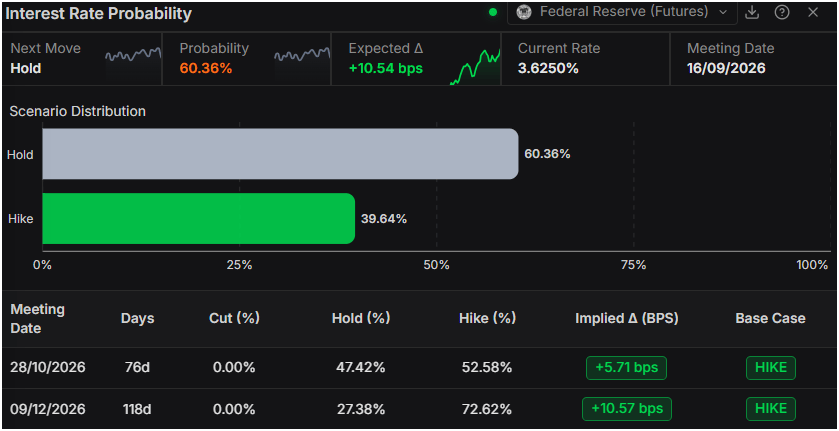
Recent US jobs data have suggested that the labor market remains solid but have also shown some signs of weakness. This, along with July’s benign inflation readings on the consumer and producer sides, might prevent an interest rate hike by the Federal Reserve at the September 16 meeting.
Money markets continued to price in a 60% chance of a Fed hold at the September meeting, with a slim chance of a 25-basis-point rate hike.
Cleveland Fed Beth Hammack crossed the wires, saying that the US central bank should raise rates to restrain growth and inflation. She commented that when talking to businesses, they’re excited to borrow so they can continue investing as they see “growth opportunities.” However, she added that a strong reacceleration of the economy could affect the disinflationary process.
Richmond Fed President Thomas Barkin said it is an “open question” whether a rate hike is needed to meet the inflation target. He said that inflationary pressures come from shocks which “should pass.”
In the UK, the economy showed that the Gross Domestic Product (GDP) grew 0.4% on a quarterly basis in Q2 2026. The reading was in line with estimates, a small dip from the 0.6% increase in the previous period, but it remains solid.
Ahead this week, the US economic docket will feature the release of the University of Michigan Consumer Sentiment. Across the pond, the UK schedule will feature a tranche of inflation data, which could trigger a reaction of the bond market, regarding setting expectations for the Bank of England (BoE) monetary policy.
In the daily chart, GBP/USD trades at 1.3497, holding above the cluster of the 50/100/200-day simple moving averages (SMA) around 1.3370 and the reclaimed trend-line levels at 1.3425 and 1.3344, which together reinforce a bullish near-term bias. The Relative Strength Index (14) at 59.3 stays in positive territory without being overbought, hinting that upside momentum is constructive rather than stretched, while the FXS Fed Sentiment Index near 136.6 suggests a still-elevated but cooling policy anxiety backdrop that may keep directional moves sensitive to incoming US data.
On the topside, immediate resistance emerges at the descending trend line break near 1.3510, followed by the higher upward-support trend-line break around 1.3575, where the recent advance could meet stronger supply. On the downside, first support is seen at the former resistance trend line now turned floor around 1.3425, ahead of the grouped long-term SMAs near 1.3370 and the lower structural trend support at 1.3344, levels that would need to give way to undermine the current bullish technical tone.
(The technical analysis of this story was written with the help of an AI tool. Know more.)
The table below shows the percentage change of British Pound (GBP) against listed major currencies today. British Pound was the strongest against the New Zealand Dollar.
| USD | EUR | GBP | JPY | CAD | AUD | NZD | CHF | |
|---|---|---|---|---|---|---|---|---|
| USD | -0.08% | -0.02% | -0.06% | -0.02% | 0.05% | 0.18% | -0.12% | |
| EUR | 0.08% | 0.06% | 0.02% | 0.03% | 0.13% | 0.24% | -0.05% | |
| GBP | 0.02% | -0.06% | -0.04% | -0.02% | 0.08% | 0.19% | -0.12% | |
| JPY | 0.06% | -0.02% | 0.04% | 0.03% | 0.12% | 0.19% | -0.07% | |
| CAD | 0.02% | -0.03% | 0.02% | -0.03% | 0.08% | 0.19% | -0.11% | |
| AUD | -0.05% | -0.13% | -0.08% | -0.12% | -0.08% | 0.12% | -0.19% | |
| NZD | -0.18% | -0.24% | -0.19% | -0.19% | -0.19% | -0.12% | -0.27% | |
| CHF | 0.12% | 0.05% | 0.12% | 0.07% | 0.11% | 0.19% | 0.27% |
The heat map shows percentage changes of major currencies against each other. The base currency is picked from the left column, while the quote currency is picked from the top row. For example, if you pick the British Pound from the left column and move along the horizontal line to the US Dollar, the percentage change displayed in the box will represent GBP (base)/USD (quote).










The information provided on this website is of a general nature only and does not constitute personal financial advice. Before acting on any information on this website, you should consider the suitability of the information in relation to your objectives, financial situation and needs. Investing in CFDs and FX Margin Contracts carries significant risks and is not suitable for all investors. You may lose more than your initial deposit. You do not own, or have, any interest in the underlying asset. We recommend that you seek independent advice and ensure you fully understand the risks involved before trading. It is important that you read and consider the disclosure document before you acquire any product listed on the website. The information and advertisements offered on this website are not intended for use by any person in any country or jurisdiction where such use would be contrary to local laws and regulations. The Products and Services offered on this website are not intended for residents of the United States, Malaysia and Thailand.
TMGM is authorized and regulated in various jurisdictions.
Trademax Australia Limited, trading as TMGM, is regulated by the Australian Securities and Investments Commission (ASIC), AFSL no. 436416 and is located at Level 28, One International Tower, 100 Barangaroo Avenue, 2000 Sydney, NSW Australia.
Email: support@tmgm.com.au
Trademax Global Limited, trading as TMGM, is authorized and regulated by the Vanuatu Financial Services Commission (VFSC), registration number 40356 and registered at 1276, Kumul Highway, Port Vila, Vanuatu, Republic of Vanuatu.
Email: support@tmgm.com
Trademax Global Markets (SE) Limited, trading as TMGM, is authorized and regulated by the Financial Services Authority (FSA) of Seychelles, with license number SD224. The company is registered at Office No 13, Providence Estate ABIS Centre, Mahe, Seychelles.
Email: support@tmgm.com
Trademax Global Markets (International) Pty Ltd, trading as TMGM, is authorized and regulated by the Financial Services Commission, Mauritius (FSC) with license no. GB22201012, and registered at 33, Edith Cavell Street C/o IQ EQ Fund Services (Mauritius) Ltd Port Louis, 11324 Mauritius.
Email: support@tmgm.com
Copyright © TMGM. All rights reserved


