
Ethereum Price Forecast: ETH falters at resistance following strong retail selling
By Michael Ebiekutan
Updated: 28 Apr 2026


POPULAR ARTICLES

Ethereum (ETH) is hovering near $2,300 on Tuesday, following signs of distribution across key onchain metrics over the past week, as US-Iran peace talks leave the market in a state of uncertainty.
Ethereum price today: $2,290
- Ethereum faces supply pressure near the cost basis of accumulation addresses.
- Retail wallets distributed 756K ETH over the past week amid persistent bearishness in perpetuals.
- ETH continues to hold the support near the 20- and 50-day EMAs.
Ethereum (ETH) is hovering near $2,300 on Tuesday, following signs of distribution across key onchain metrics over the past week, as US-Iran peace talks leave the market in a state of uncertainty.
The Accumulation Addresses Realized Price (AARP) has historically acted as a support level. However, since ETH declined below it for the first time in February, the level has served as a resistance, with supply outweighing demand whenever prices approach it. The AARP resistance at $2,400 kicked in again over the past week as ETH saw distribution near the level.
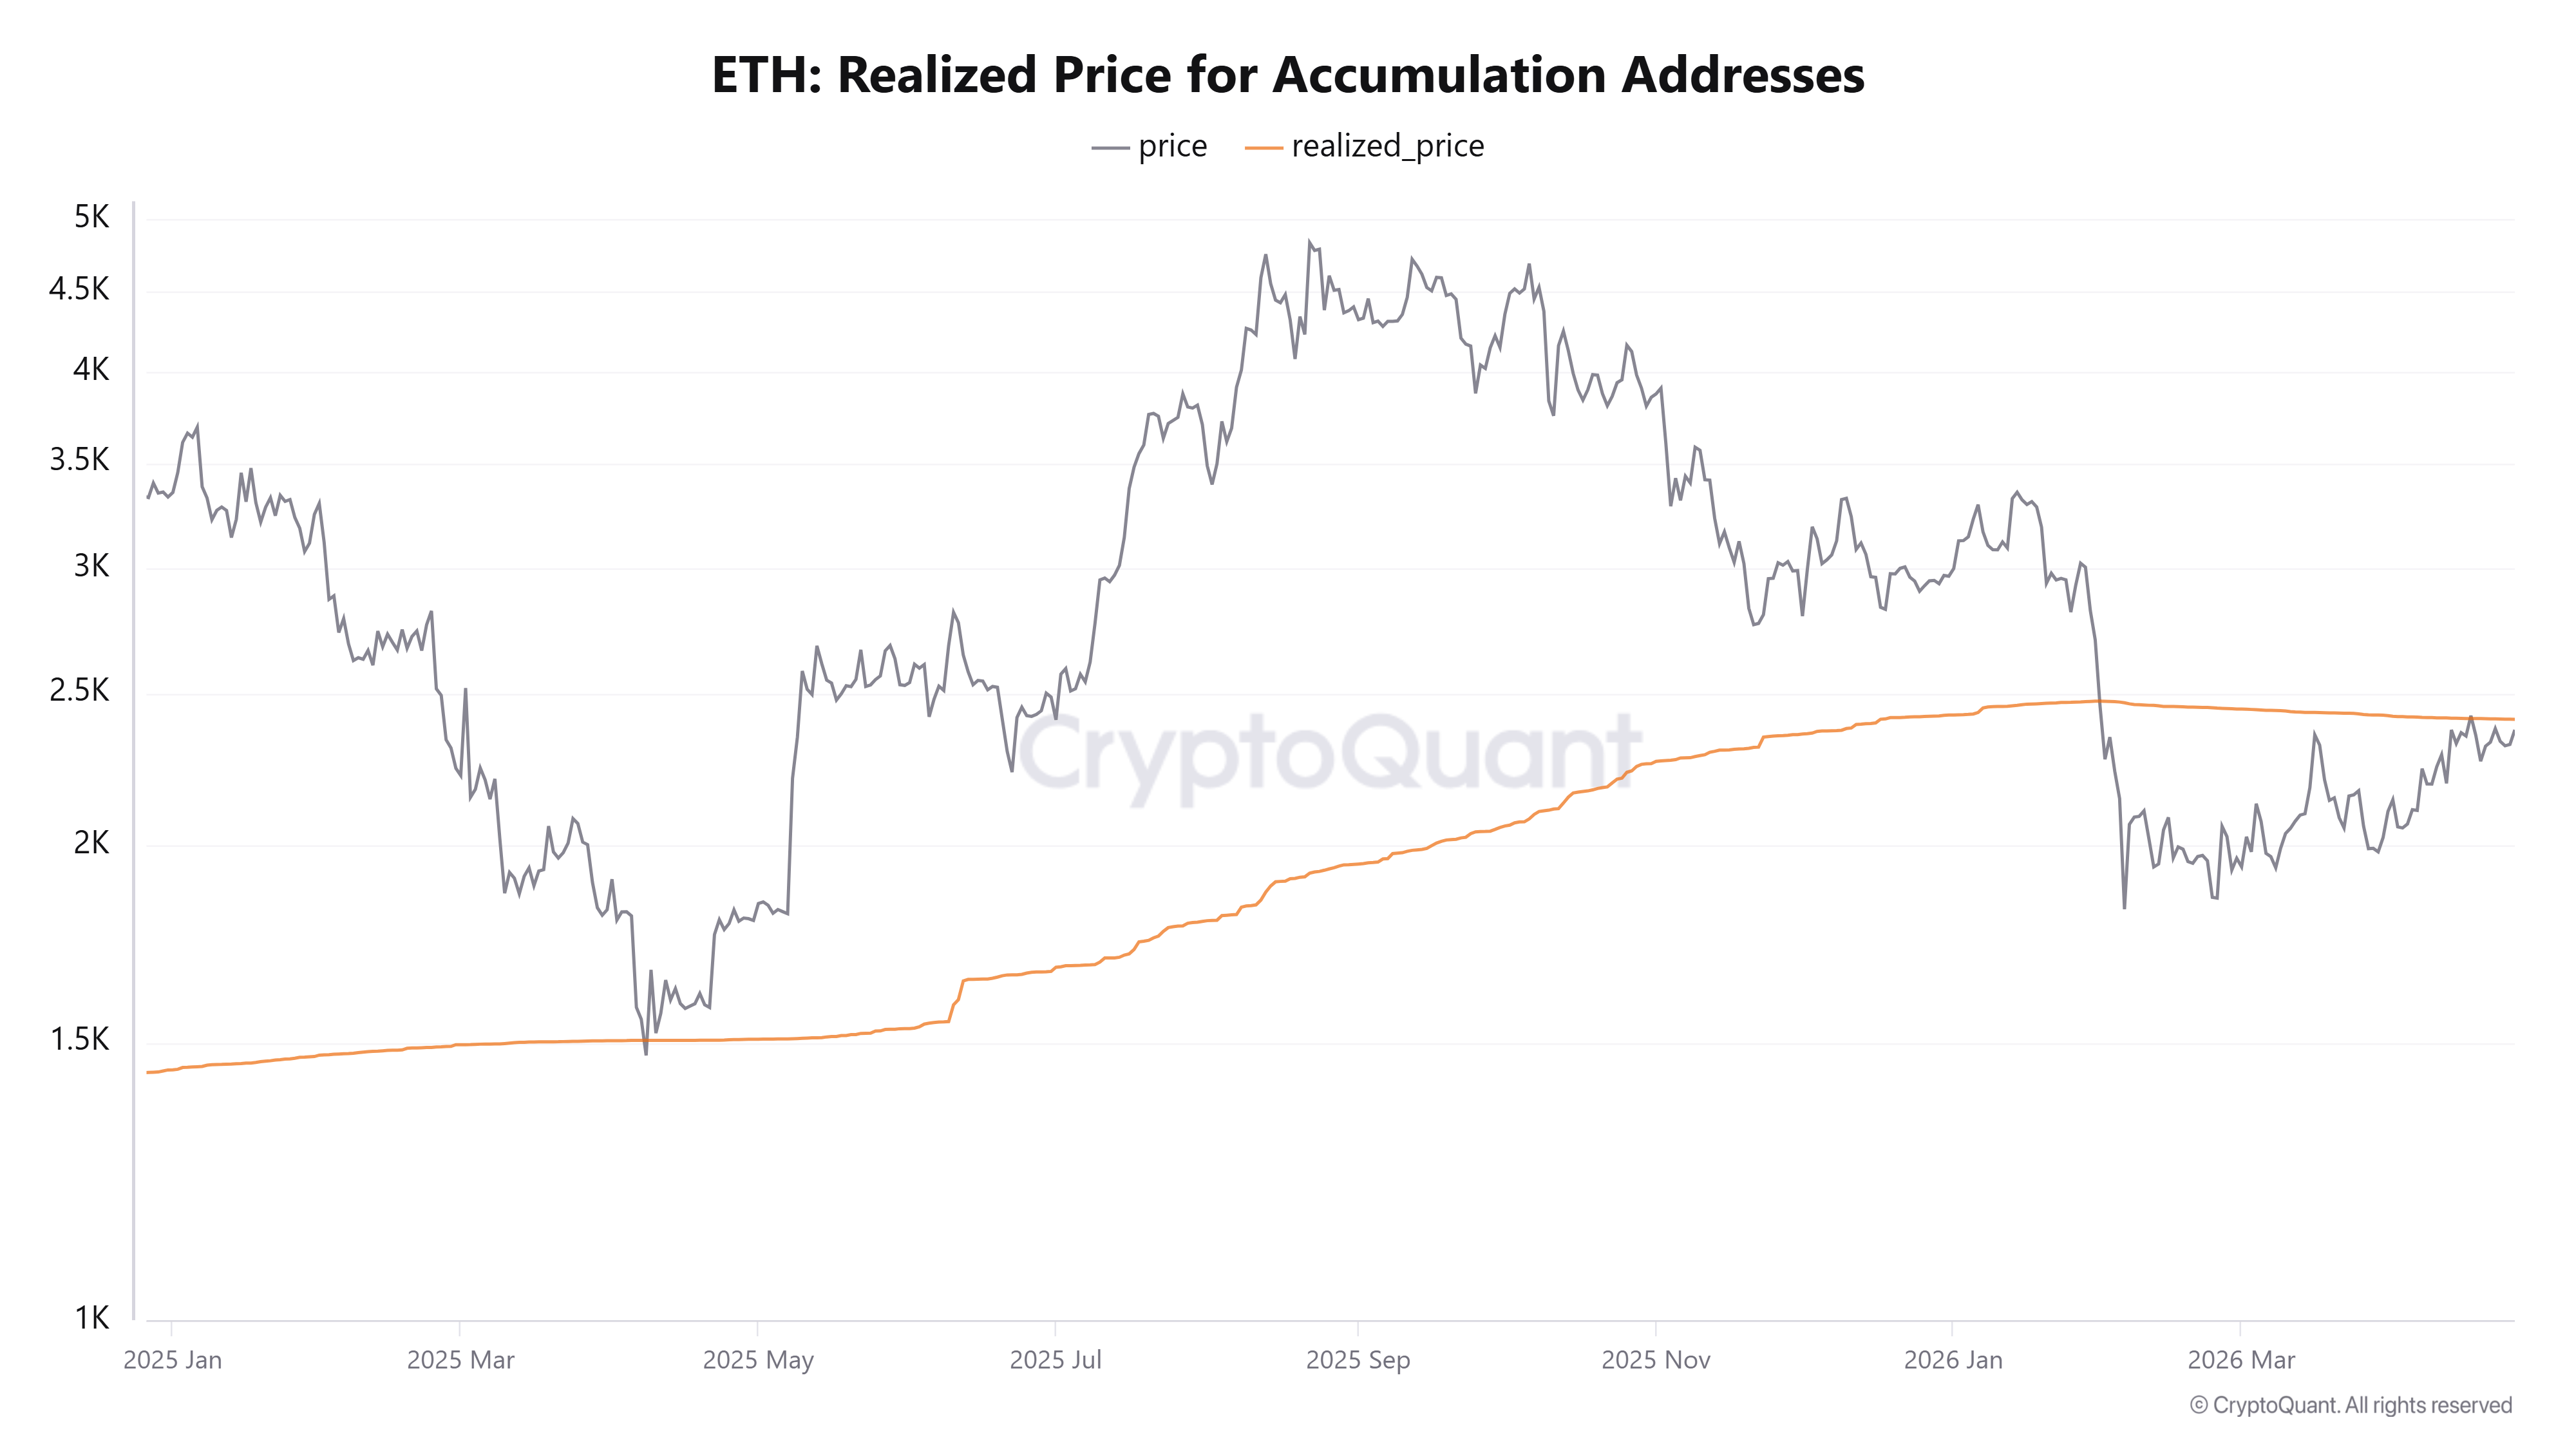
The selling was spearheaded by the retail cohort (wallets holding 100-1K and 1K-10K ETH), which saw combined outflows of roughly 756K ETH.
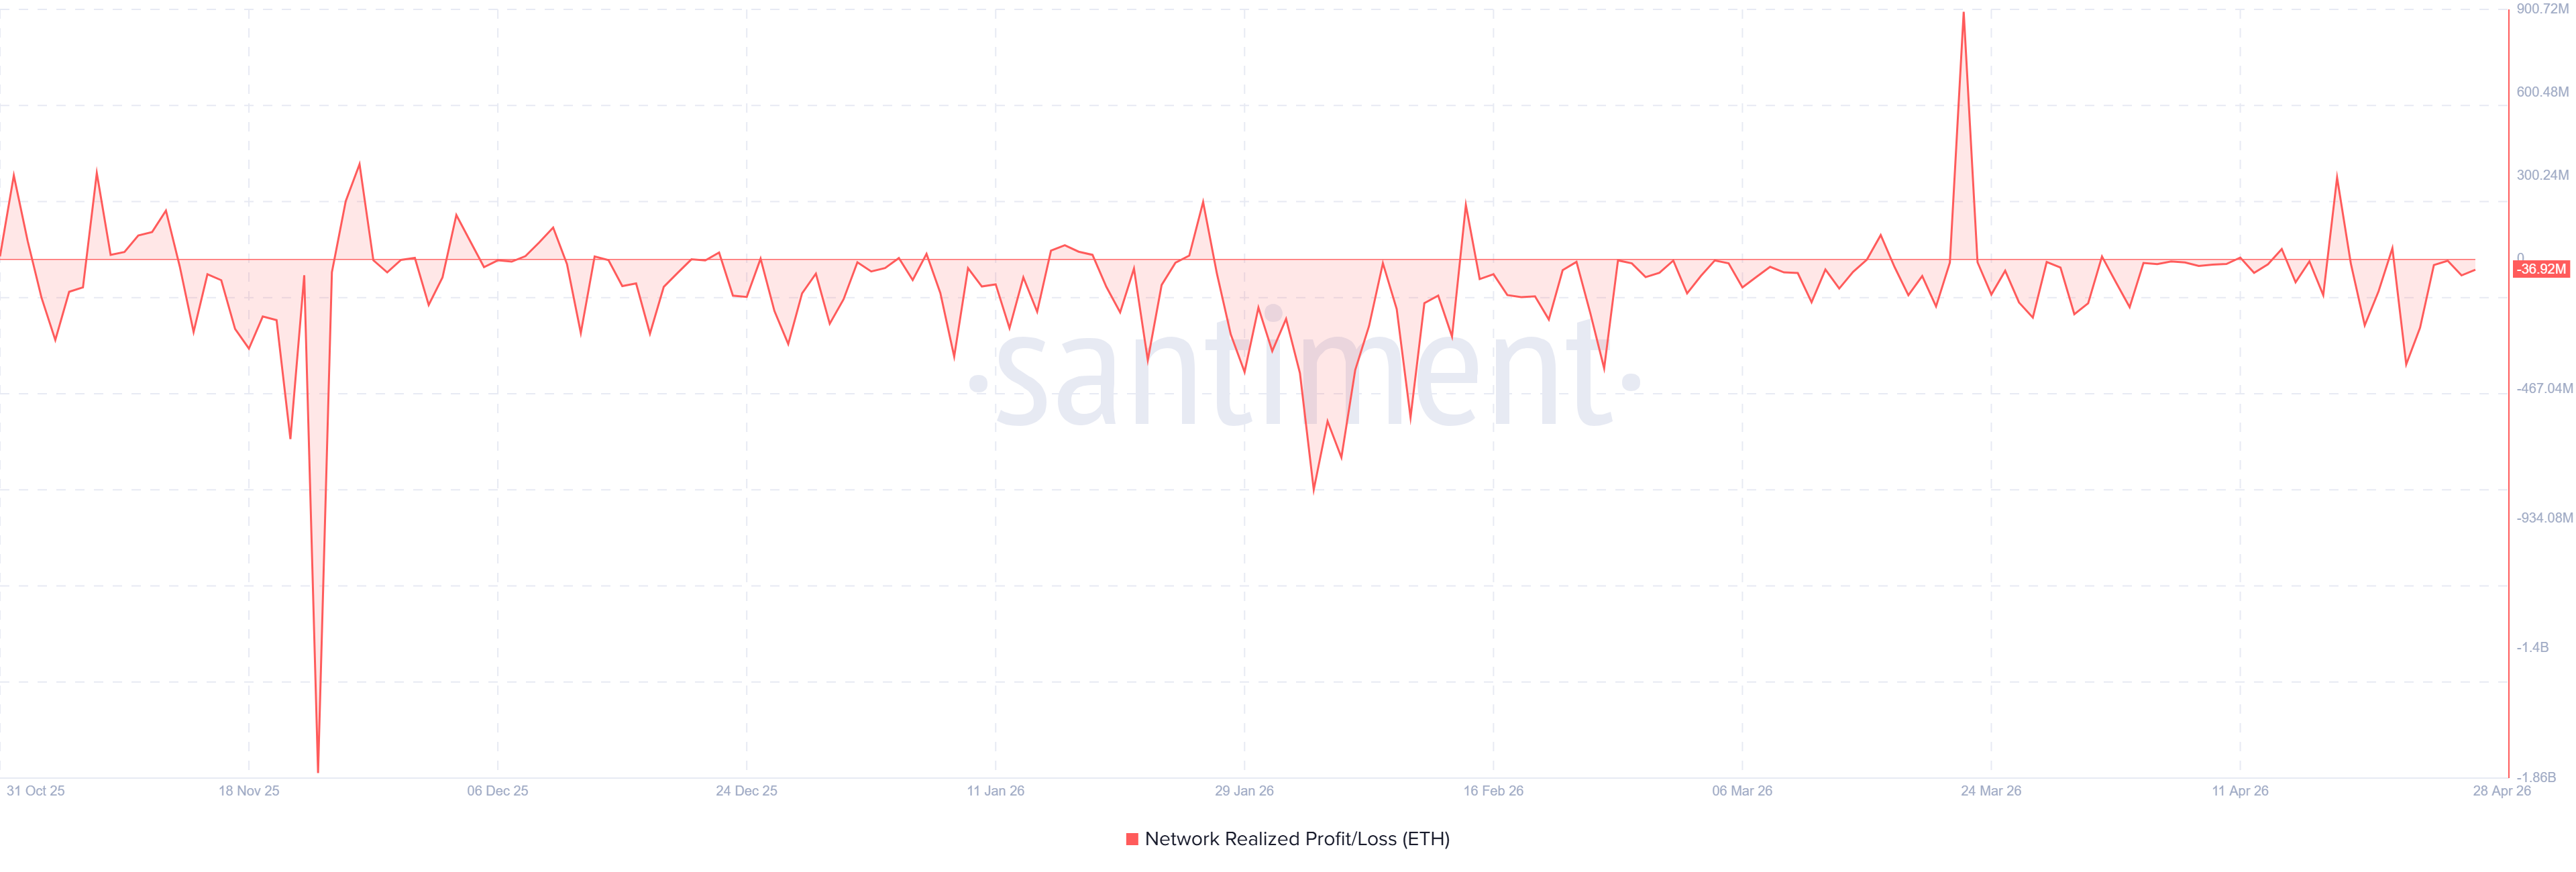
The period was marked by an increase in realized losses, meaning most of the distributed tokens were underwater. With uncertainty surrounding the US-Iran ceasefire negotiations and prices near their onchain cost basis, retailers may have offloaded tokens to cut losses.
Whales, on the other hand, held steady, adding 60K to their holdings. While they slowed down accumulation, their activity showed resilience amid uncertainty in macroeconomic conditions.
Meanwhile, Ethereum is also experiencing a bearish bias on the derivatives market, where consistent negative funding rates have plagued ETH perpetuals.
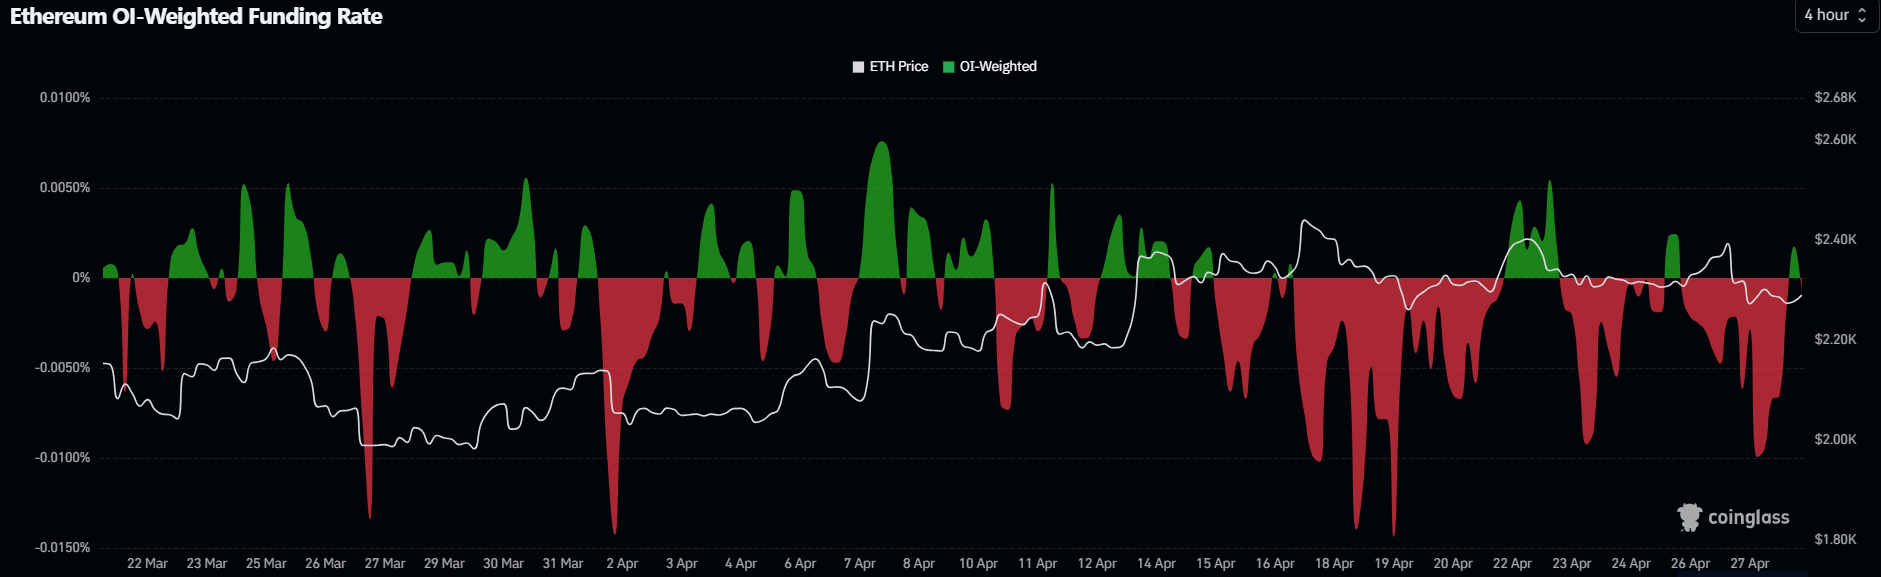
The red-filled area shows that shorts have largely dominated positions in the largest altcoin's perpetual market over the past few weeks, even as open interest (OI) has ticked downward.
Ethereum Price Forecast: ETH holds support near 20- and 50-day EMAs
On the daily chart, ETH is holding a neutral to slightly constructive bias as price hovers just above the 20- and 50-day Exponential Moving Averages (EMAs) at $2,293 and $2,243, respectively, while remaining capped below the 100-day EMA near $2,370.
The Relative Strength Index (RSI) sits close to 52, hinting at balanced momentum, while the Stochastic Oscillator (Stoch) has retreated toward oversold territory, suggesting that downside follow-through could be limited as long as ETH defends the nearby EMA support band.
On the topside, immediate resistance emerges at the convergence of the 100-day EMA and the horizontal cap near $2,388. A daily close above this cluster would open the way toward the next resistance zones around $2,746 and then $3,411.
On the downside, initial support is defined by the 20-day EMA, with the 50-day EMA and the horizontal level near $2,211 reinforcing the broader floor. A break below these would expose deeper supports at $2,107 and $1,909 before the more distant structural base around $1,741.
(The technical analysis of this story was written with the help of an AI tool.)

More than a million users rely on FXStreet for real-time market data, charting tools, expert insights, and forex news. Its comprehensive economic calendar and educational webinars help traders stay informed and make calculated decisions. FXStreet is supported by a team of about 60 professionals, split between the Barcelona headquarters and various global regions.
Read More


