
Gold hovers near $4,700 as higher-for-longer rate outlook limits upside
By Vishal Chaturvedi
Updated: 13 May 2026


POPULAR ARTICLES

Gold (XAU/USD) consolidates minor losses on Wednesday as the US Dollar (USD) extends its recovery amid persistent uncertainty over US-Iran talks and growing expectations that the Federal Reserve (Fed) could keep interest rates higher for longer.
- Gold trades cautiously lower on Wednesday, pressured by a stronger US Dollar and elevated US Treasury yields.
- Fed rate hike expectations gain traction after US CPI accelerated to its highest level since May 2023.
- On the 4-hour chart, Gold trades just below the Bollinger midline near $4,706, with subdued ADX readings signaling weak trend strength.
Gold (XAU/USD) consolidates minor losses on Wednesday as the US Dollar (USD) extends its recovery amid persistent uncertainty over US-Iran talks and growing expectations that the Federal Reserve (Fed) could keep interest rates higher for longer. At the time of writing, XAU/USD is trading around the $4,700 psychological mark, posting modest intraday losses of about 0.25%.
Higher energy prices caused by supply disruptions in the Middle East continued to feed into US inflation, with the headline Consumer Price Index (CPI) accelerating to 3.8% YoY in April from 3.3% in March, above market expectations of 3.7% and marking the highest reading since May 2023.
The hotter-than-expected inflation data further reduced expectations for Fed interest rate cuts this year, with traders now increasingly pricing in the possibility that the central bank’s next policy move could be a rate hike. This, in turn, has pushed US Treasury yields higher, reducing the appeal of non-yielding assets such as Gold.
Attention now turns to the upcoming US Producer Price Index (PPI) figures, which could provide fresh clues about the Fed’s monetary policy path and the broader inflation outlook.
According to the CME FedWatch tool, traders expect the Fed to keep borrowing costs unchanged in the coming months, though the chances of a rate hike rise to around 33% by December and nearly 41.5% by January 2027.
The higher-for-longer interest rate outlook has kept Gold under pressure since the onset of the US-Iran war, diminishing its appeal as both an inflation hedge and a safe-haven asset.
Meanwhile, India’s decision to sharply raise import tariffs on Gold and Silver from 6% to 15% is also drawing attention across bullion markets. The move triggered a surge in domestic Gold prices and could dampen physical demand from one of the world’s largest consumers of the precious metal in the coming months.
On the geopolitical front, there appears to be no near-term resolution in sight to end the war in the Middle East, as peace negotiations between the US and Iran remain deadlocked over Tehran’s nuclear program, keeping the Strait of Hormuz effectively closed.
US President Donald Trump is scheduled to meet Chinese President Xi Jinping later this week. Speaking to reporters on Tuesday, Trump said he does not need China’s assistance in ending the war with Iran and added that the US would win the war “one way or the other.”
Technical Analysis: Range-bound trade persists near $4,700 amid weak momentum
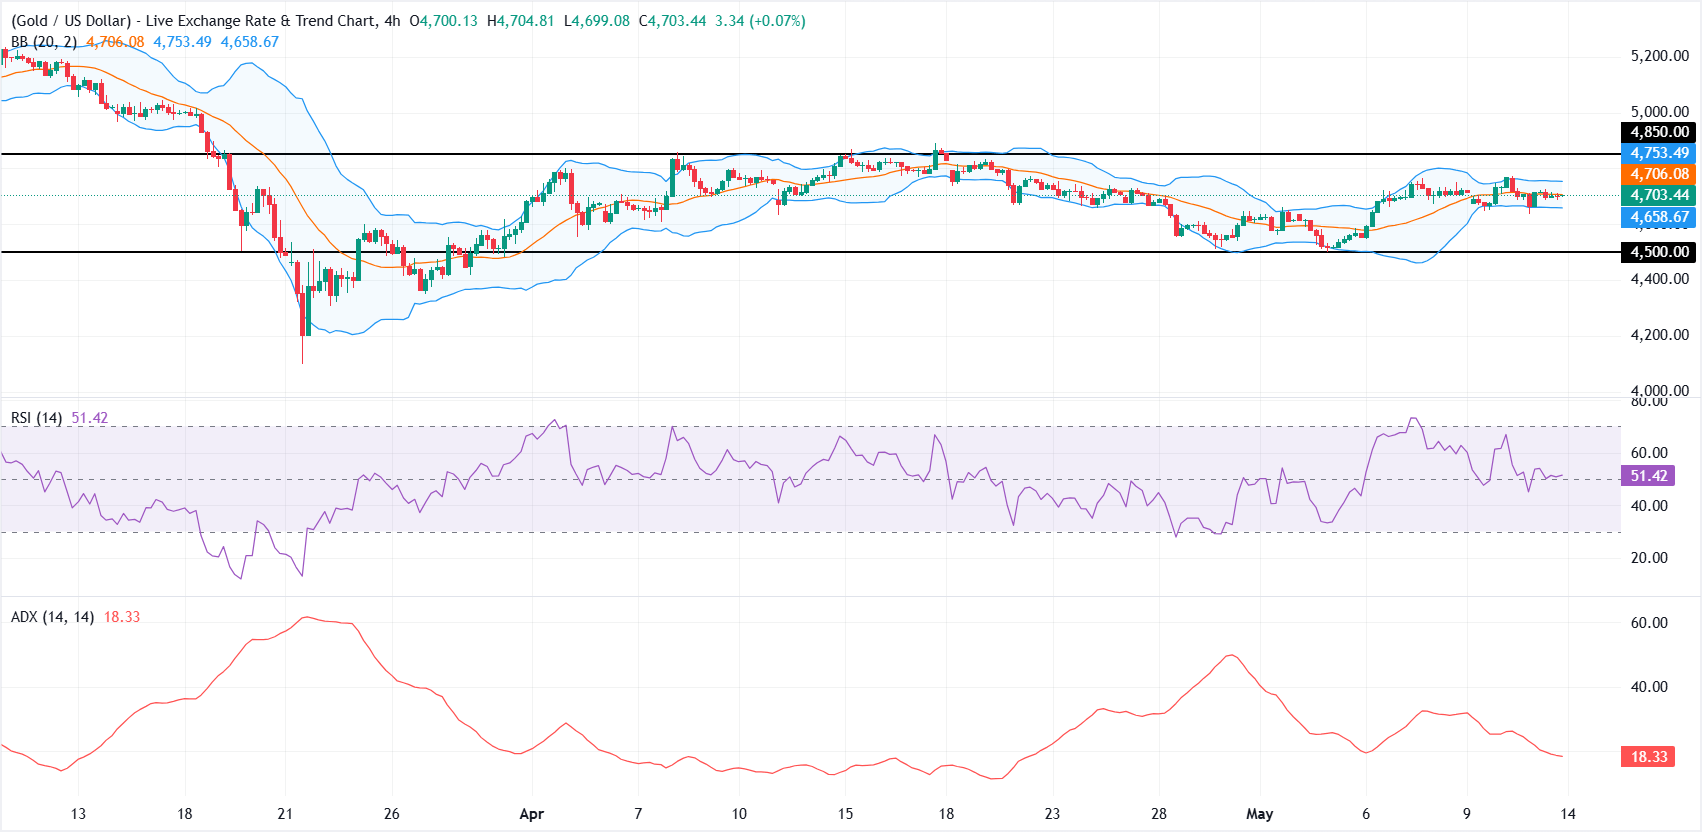
On the 4-hour chart, XAU/USD is consolidating just under the 20-period Bollinger Simple Moving Average (SMA) at roughly $4,706, keeping the near-term tone neutral after the recent pullback from higher levels.
The Bollinger bands show price holding in the upper half of the envelope, but the Relative Strength Index (RSI) around 51 and Average Directional Index (ADX) near 18 suggest fading momentum and a weak directional trend, hinting at range-bound conditions rather than a decisive breakout.
On the topside, initial resistance emerges at the Bollinger midline near $4,706, with the upper band around $4,753.49 acting as the next cap ahead of the horizontal barrier at $4,850.00.
On the downside, the lower Bollinger band at approximately $4,658.67 offers the first layer of support, with more robust underlying demand expected near the horizontal support zone around $4,500.00 if sellers regain control.
(The technical analysis of this story was written with the help of an AI tool.)
Gold FAQs
Gold has played a key role in human’s history as it has been widely used as a store of value and medium of exchange. Currently, apart from its shine and usage for jewelry, the precious metal is widely seen as a safe-haven asset, meaning that it is considered a good investment during turbulent times. Gold is also widely seen as a hedge against inflation and against depreciating currencies as it doesn’t rely on any specific issuer or government.
Central banks are the biggest Gold holders. In their aim to support their currencies in turbulent times, central banks tend to diversify their reserves and buy Gold to improve the perceived strength of the economy and the currency. High Gold reserves can be a source of trust for a country’s solvency. Central banks added 1,136 tonnes of Gold worth around $70 billion to their reserves in 2022, according to data from the World Gold Council. This is the highest yearly purchase since records began. Central banks from emerging economies such as China, India and Turkey are quickly increasing their Gold reserves.
Gold has an inverse correlation with the US Dollar and US Treasuries, which are both major reserve and safe-haven assets. When the Dollar depreciates, Gold tends to rise, enabling investors and central banks to diversify their assets in turbulent times. Gold is also inversely correlated with risk assets. A rally in the stock market tends to weaken Gold price, while sell-offs in riskier markets tend to favor the precious metal.
The price can move due to a wide range of factors. Geopolitical instability or fears of a deep recession can quickly make Gold price escalate due to its safe-haven status. As a yield-less asset, Gold tends to rise with lower interest rates, while higher cost of money usually weighs down on the yellow metal. Still, most moves depend on how the US Dollar (USD) behaves as the asset is priced in dollars (XAU/USD). A strong Dollar tends to keep the price of Gold controlled, whereas a weaker Dollar is likely to push Gold prices up.

More than a million users rely on FXStreet for real-time market data, charting tools, expert insights, and forex news. Its comprehensive economic calendar and educational webinars help traders stay informed and make calculated decisions. FXStreet is supported by a team of about 60 professionals, split between the Barcelona headquarters and various global regions.
Read More


