
Ripple Price Forecast: XRP advances past $1.40 as bulls face near-term resistance
By John Isige
Updated: 5 May 2026


POPULAR ARTICLES

Ripple (XRP) gains momentum, albeit gradually, trading above $1.40 at the time of writing on Tuesday.
- XRP rises and holds above $1.40, aligning with the broader increase in crypto prices on Tuesday.
- XRP saw mild inflows of $3.87 million into spot ETFs on Monday, signaling growing risk appetite.
- XRP momentum indicators remain cautiously optimistic, as the RSI trends above neutral, indicating strengthening bullish sentiment.
Ripple (XRP) gains momentum, albeit gradually, trading above $1.40 at the time of writing on Tuesday. The remittance token has, along with the broader crypto market, shown resilience amid the conflict in the Middle East, especially with the United States (US)-Iran ceasefire coming under immense strain.
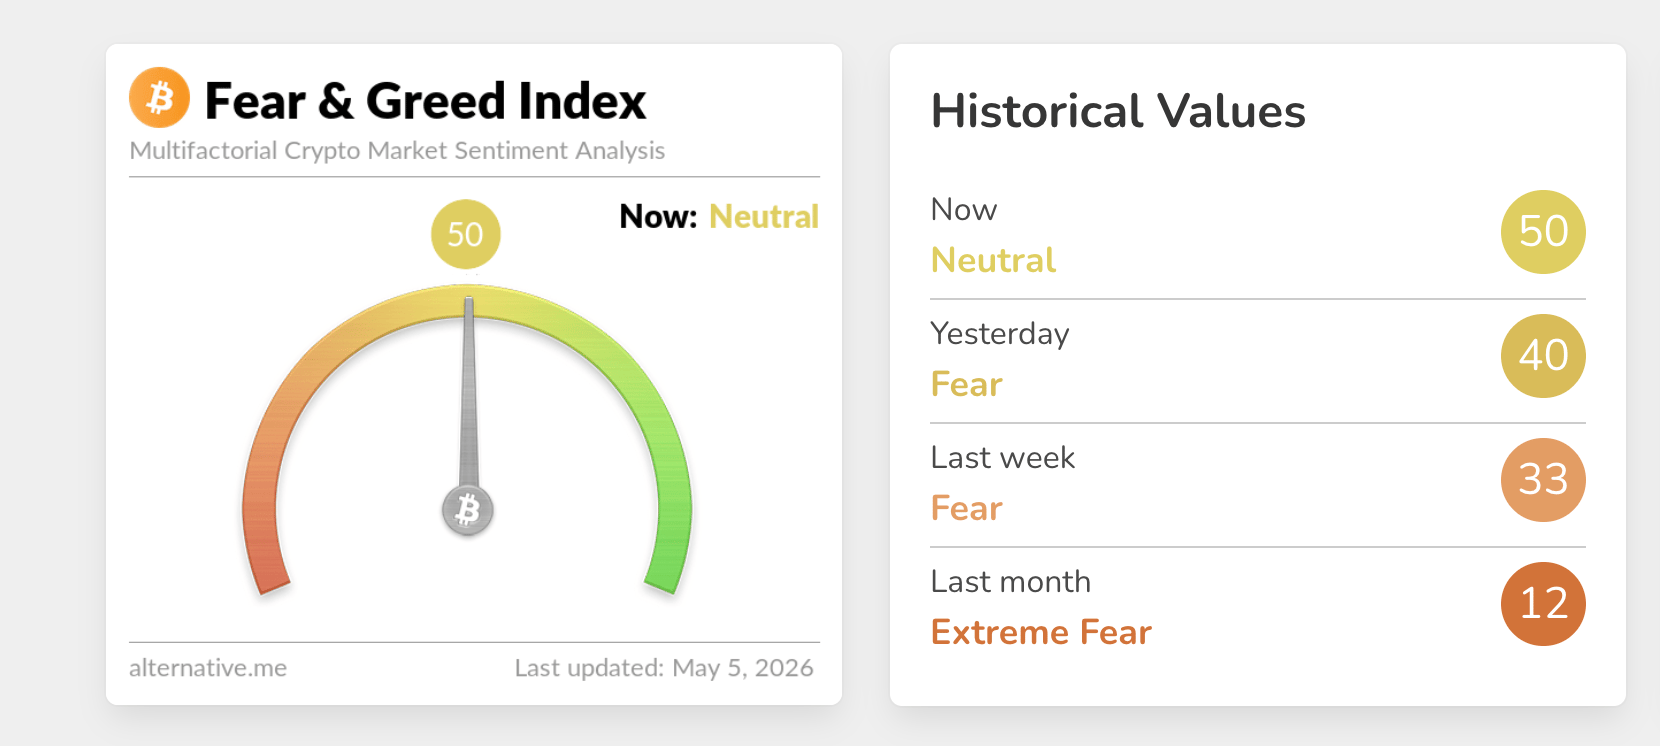
Appetite for risk assets, including XRP, has stabilized over the last few weeks, as reflected by the Crypto Fear & Greed Index rising to 50 on Tuesday in the fear territory, from 40 the previous day.
XRP ETF inflows return amid steady retail demand
Interest in XRP spot Exchange-Traded Funds (ETFs) has generally been whipsawing, suggesting that investors are cautiously optimistic about a bullish short- to medium-term outcome.
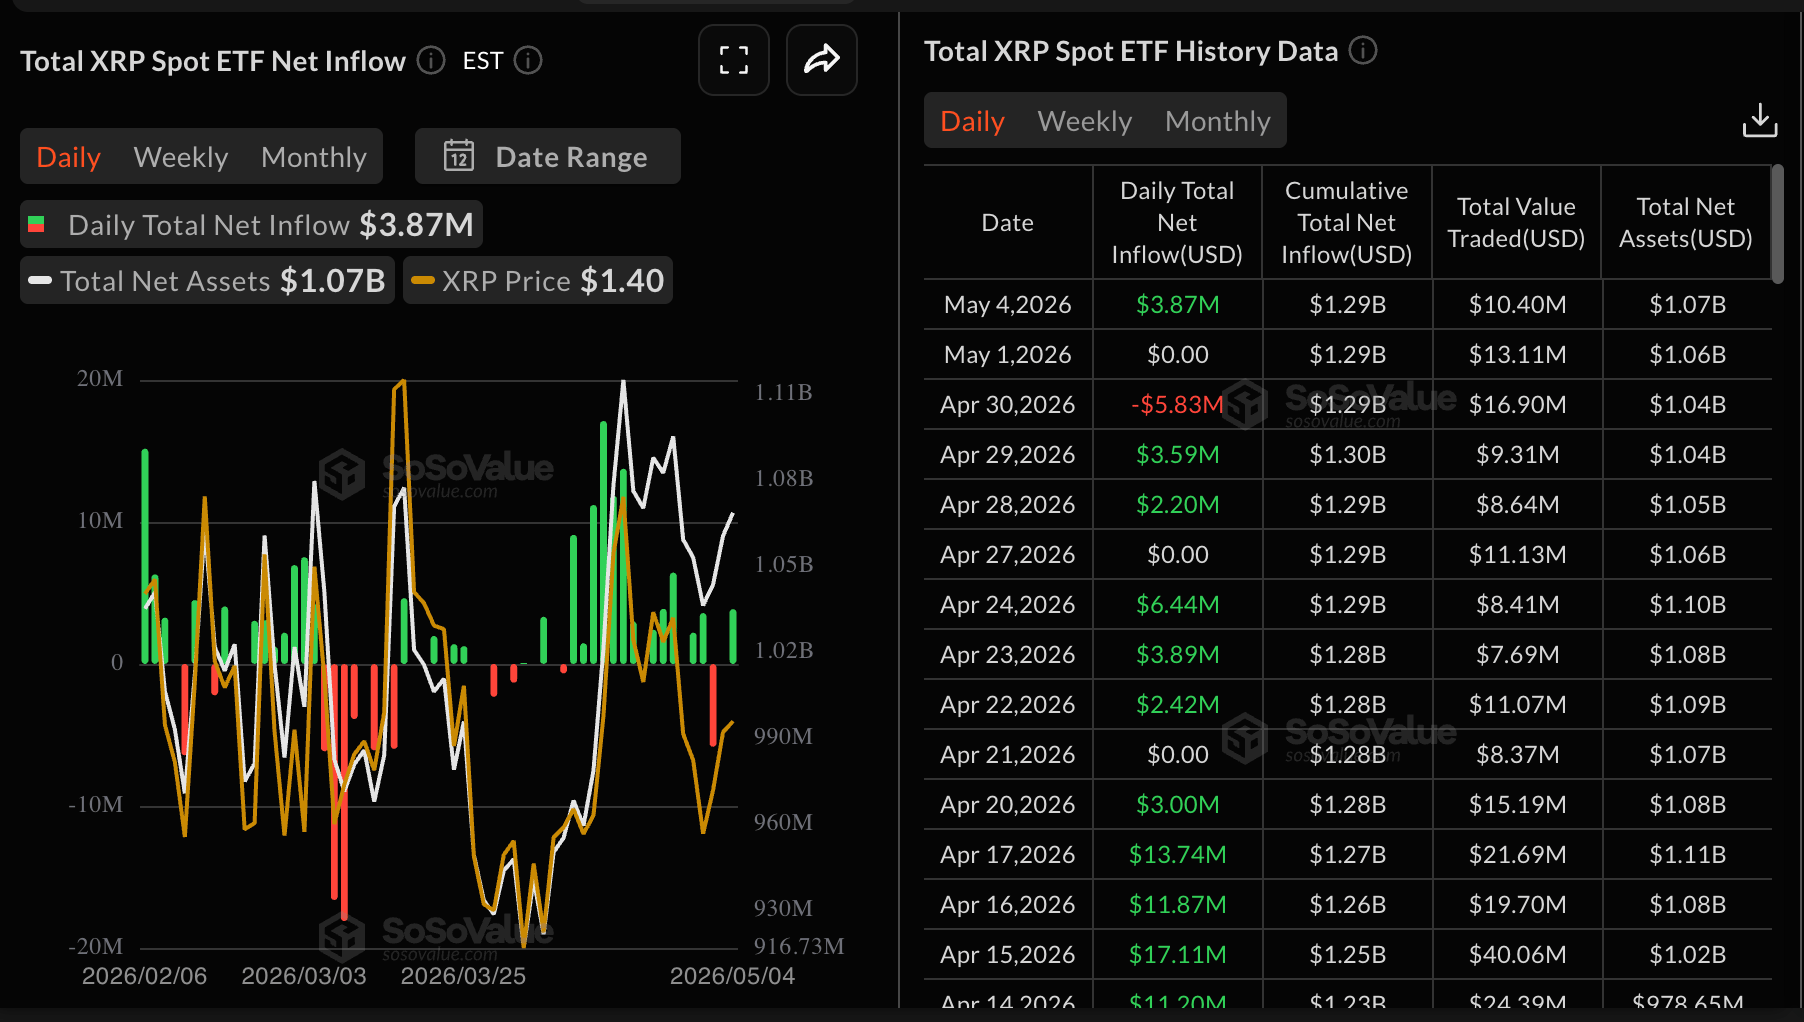
US-listed XRP spot ETFs saw mild inflows totaling $3.87 million on Monday, following muted activity on Friday, reinforcing the above analysis.
Still, cumulative inflows stand at $1.29 billion, with net assets under management at $1.07 billion. Steady inflows into ETFs are important for maintaining positive market sentiment and increasing the likelihood of a sustained breakout and an uptrend.
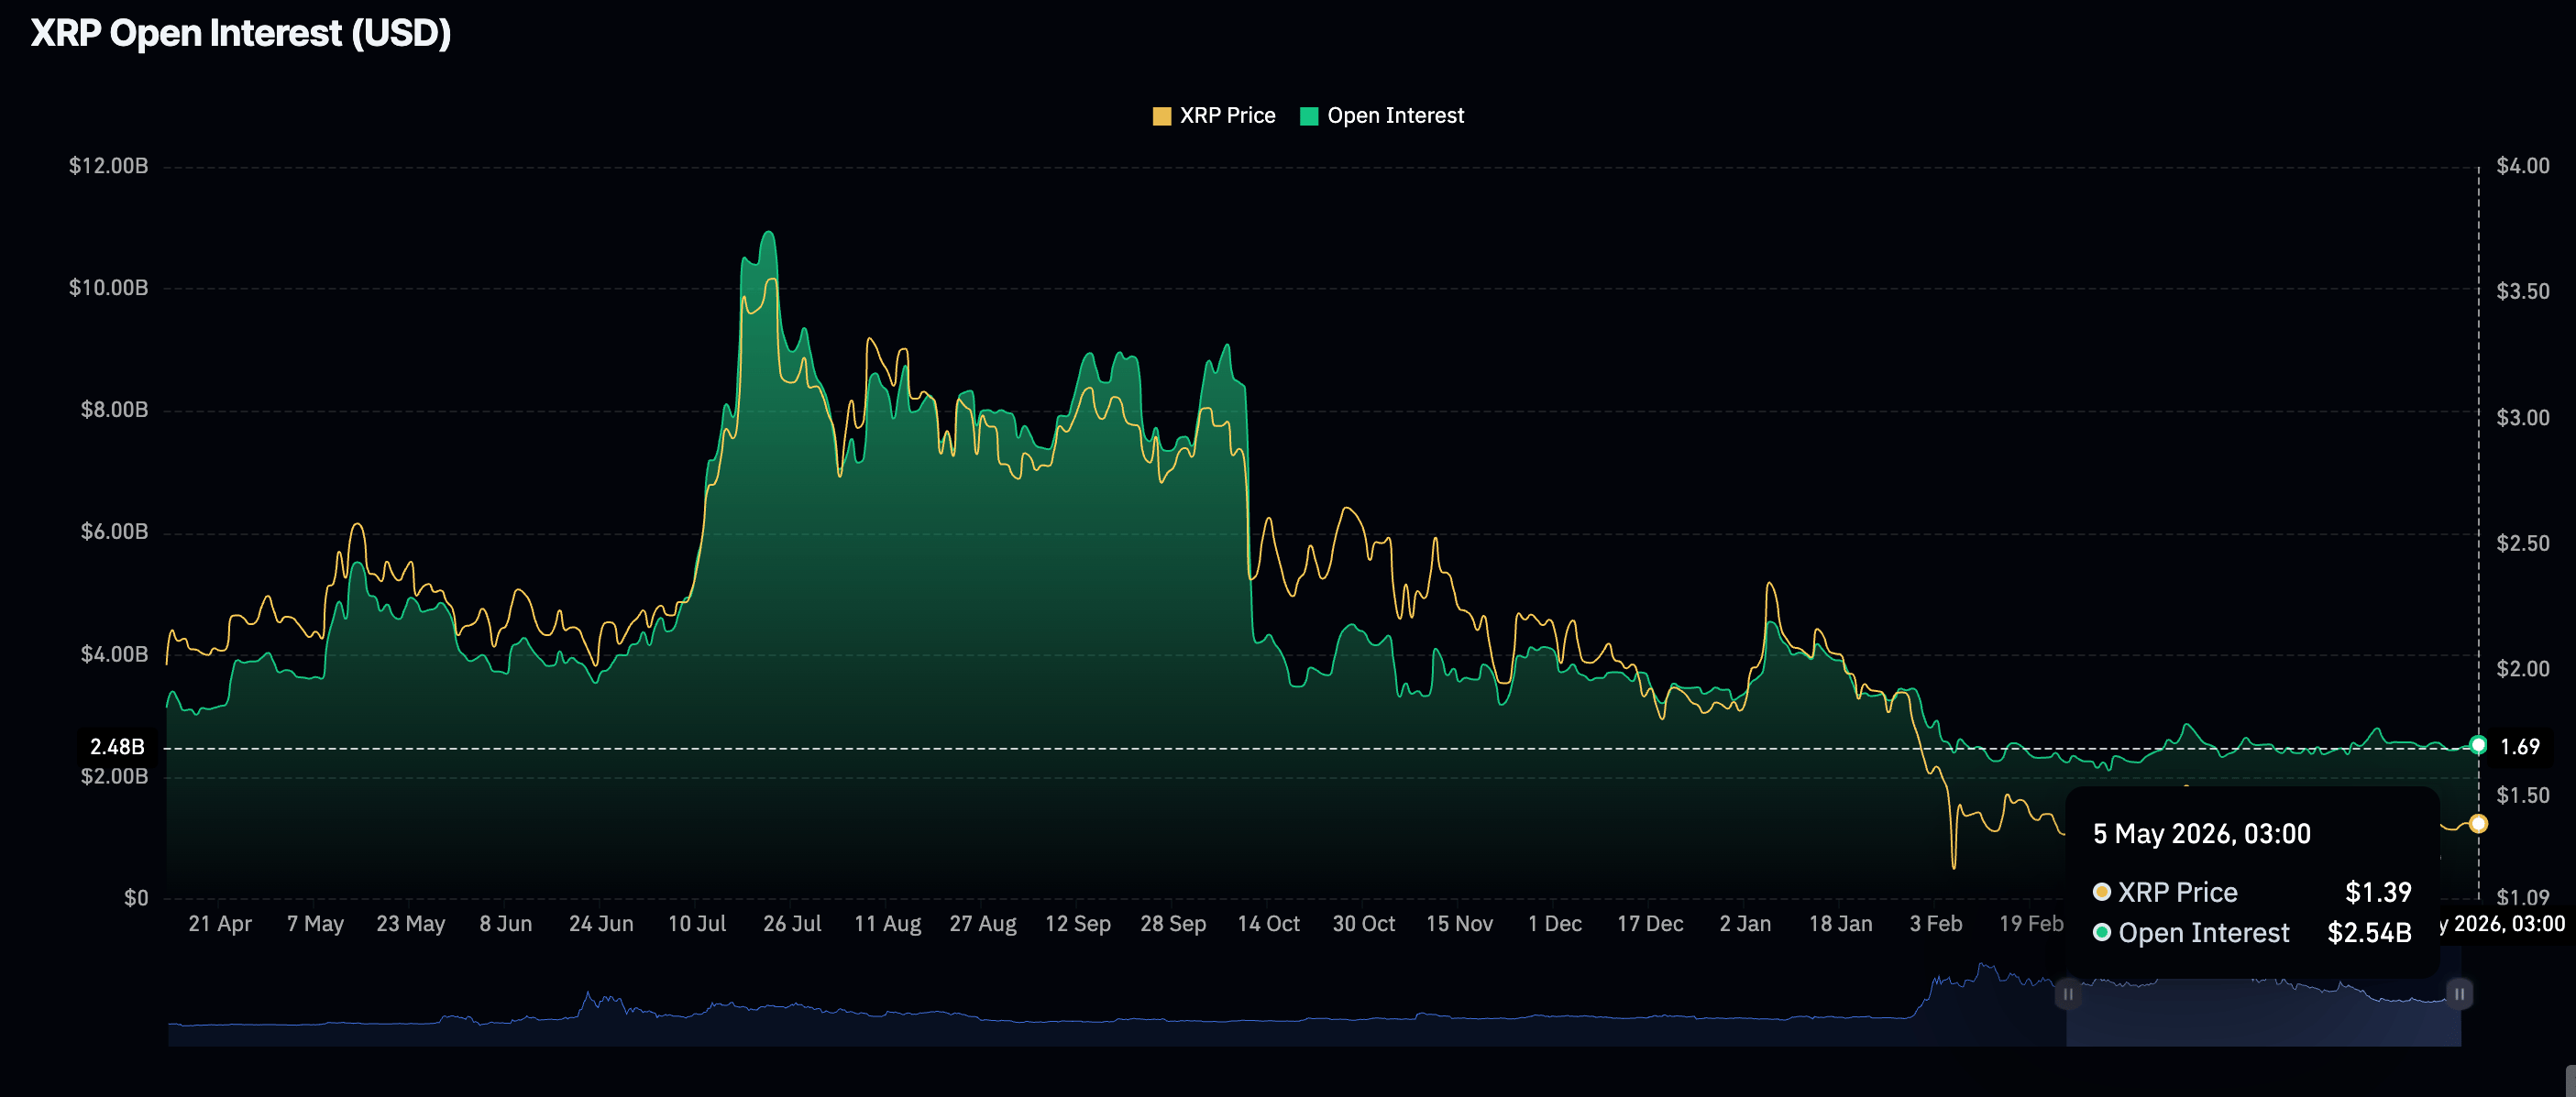
Turning to the derivatives market, interest remains on the back foot, considering the perpetual futures Open Interest (OI) steadied at $2.54 billion on Monday, up slightly from $2.50 billion the previous day.
Conversely, OI surged to $10.94 billion in July, mirroring XRP’s all-time high of $3.66. This highlights the pivotal role of retail participation in driving and maintaining upward price momentum.
Technical outlook: XRP eyes key range breakout
XRP trades above $1.4, maintaining a bearish near-term bias as it sits beneath a dense band of moving average resistance. The token is marginally below the 50-day Exponential Moving Average (EMA) at $1.41 and well under the 100-day and 200-day EMAs at $1.51 and $1.74, respectively. This outlook suggests rallies remain capped for now.
Meanwhile, the Relative Strength Index (RSI) at 52 on the daily chart leans slightly positive but still looks more consistent with consolidation than a decisive bullish impulse. At the same time, the negative but contracting Moving Average Convergence Divergence (MACD) histogram on the same chart hints that downside momentum is fading rather than reversing.
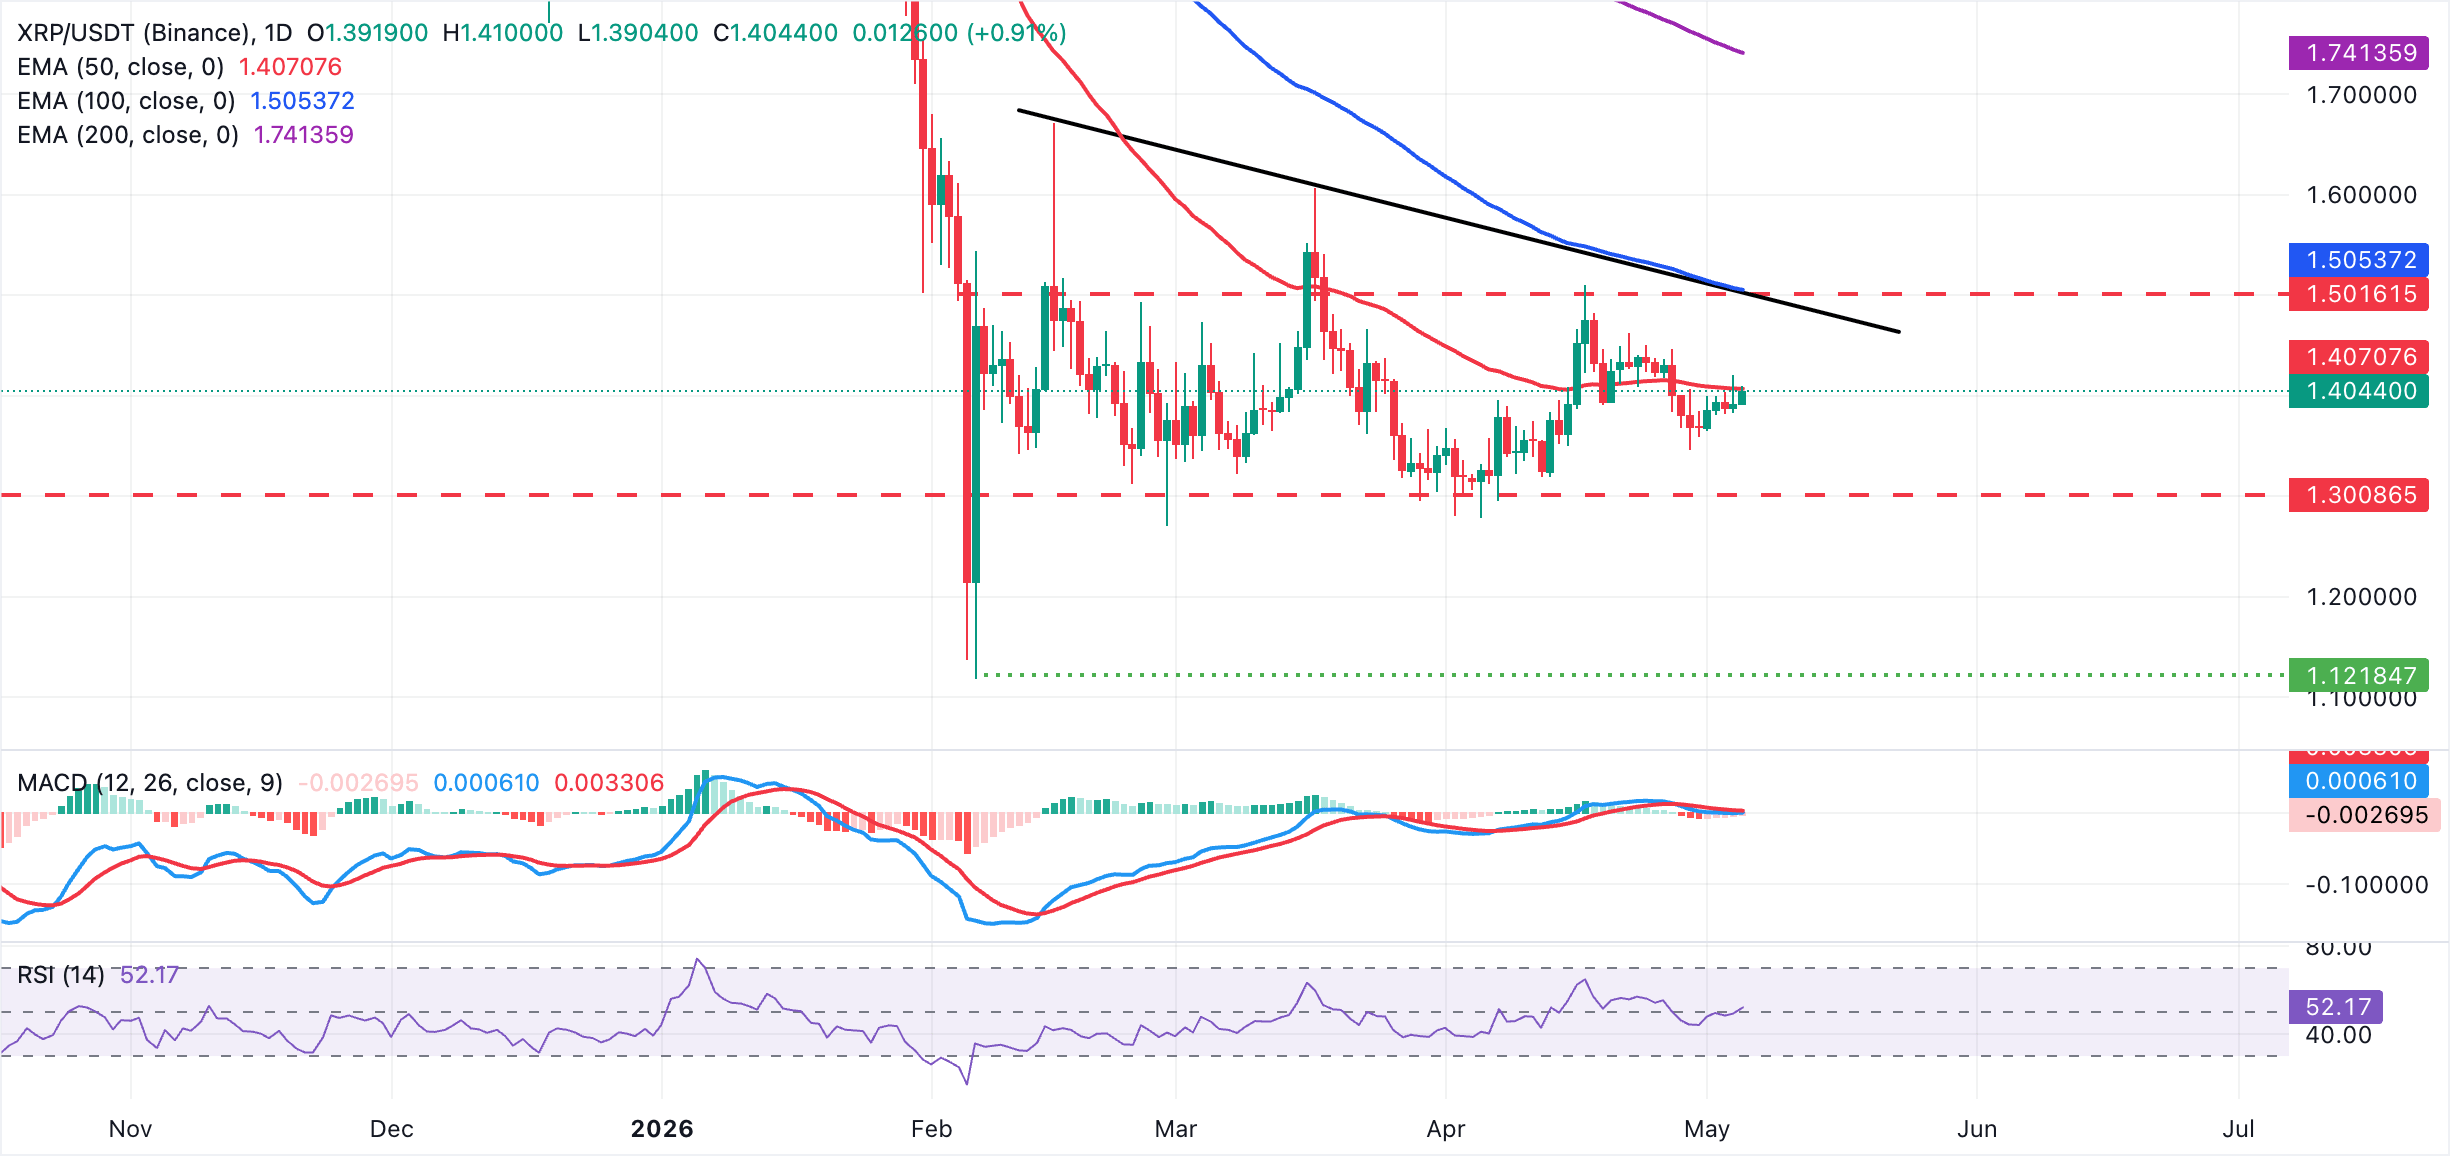
On the topside, immediate resistance is set by the 50-day EMA at $1.41, with stronger barriers emerging near the confluence of the longer-term downtrend structure and the 100-day EMA in the $1.51 area.
A daily close above that zone would be needed to ease the prevailing bearish tone and open the way toward the 200-day EMA at $1.74. On the downside, the daily low at $1.39 serves as the immediate support, followed by the monthly open around $1.37.
(The technical analysis of this story was written with the help of an AI tool.)
Open Interest, funding rate FAQs
Higher Open Interest is associated with higher liquidity and new capital inflow to the market. This is considered the equivalent of increase in efficiency and the ongoing trend continues. When Open Interest decreases, it is considered a sign of liquidation in the market, investors are leaving and the overall demand for an asset is on a decline, fueling a bearish sentiment among investors.
Funding fees bridge the difference between spot prices and prices of futures contracts of an asset by increasing liquidation risks faced by traders. A consistently high and positive funding rate implies there is a bullish sentiment among market participants and there is an expectation of a price hike. A consistently negative funding rate for an asset implies a bearish sentiment, indicating that traders expect the cryptocurrency’s price to fall and a bearish trend reversal is likely to occur.

More than a million users rely on FXStreet for real-time market data, charting tools, expert insights, and forex news. Its comprehensive economic calendar and educational webinars help traders stay informed and make calculated decisions. FXStreet is supported by a team of about 60 professionals, split between the Barcelona headquarters and various global regions.
Read More


