
Ripple Price Forecast: XRP stabilizes as support holds amid steady ETF inflows
By John Isige
Updated: 29 Jun 2026


POPULAR ARTICLES

Ripple (XRP) pares losses and trades around $1.05 at the time of writing on Monday. The cross-border remittance token is attempting a recovery after last week’s sell-off, which intensified as the United States (US) and Iran exchanged fire.
- XRP trades sideways around $1.05 on Monday, mirroring a mild recovery in the broader crypto market.
- US-listed XRP spot ETFs saw steady inflows of $23 million last week, while futures Open Interest remains weak at $2.36 billion.
- XRP’s technical outlook remains weak, defined by downward-sloping moving averages and weak momentum indicators.
Ripple (XRP) pares losses and trades around $1.05 at the time of writing on Monday. The cross-border remittance token is attempting a recovery after last week’s sell-off, which intensified as the United States (US) and Iran exchanged fire.
Steady gains above $1.05 would affirm a bullish turnaround, given that Bitcoin (BTC) and Ethereum (ETH) are also edging higher.
XRP attracts modest capital inflows
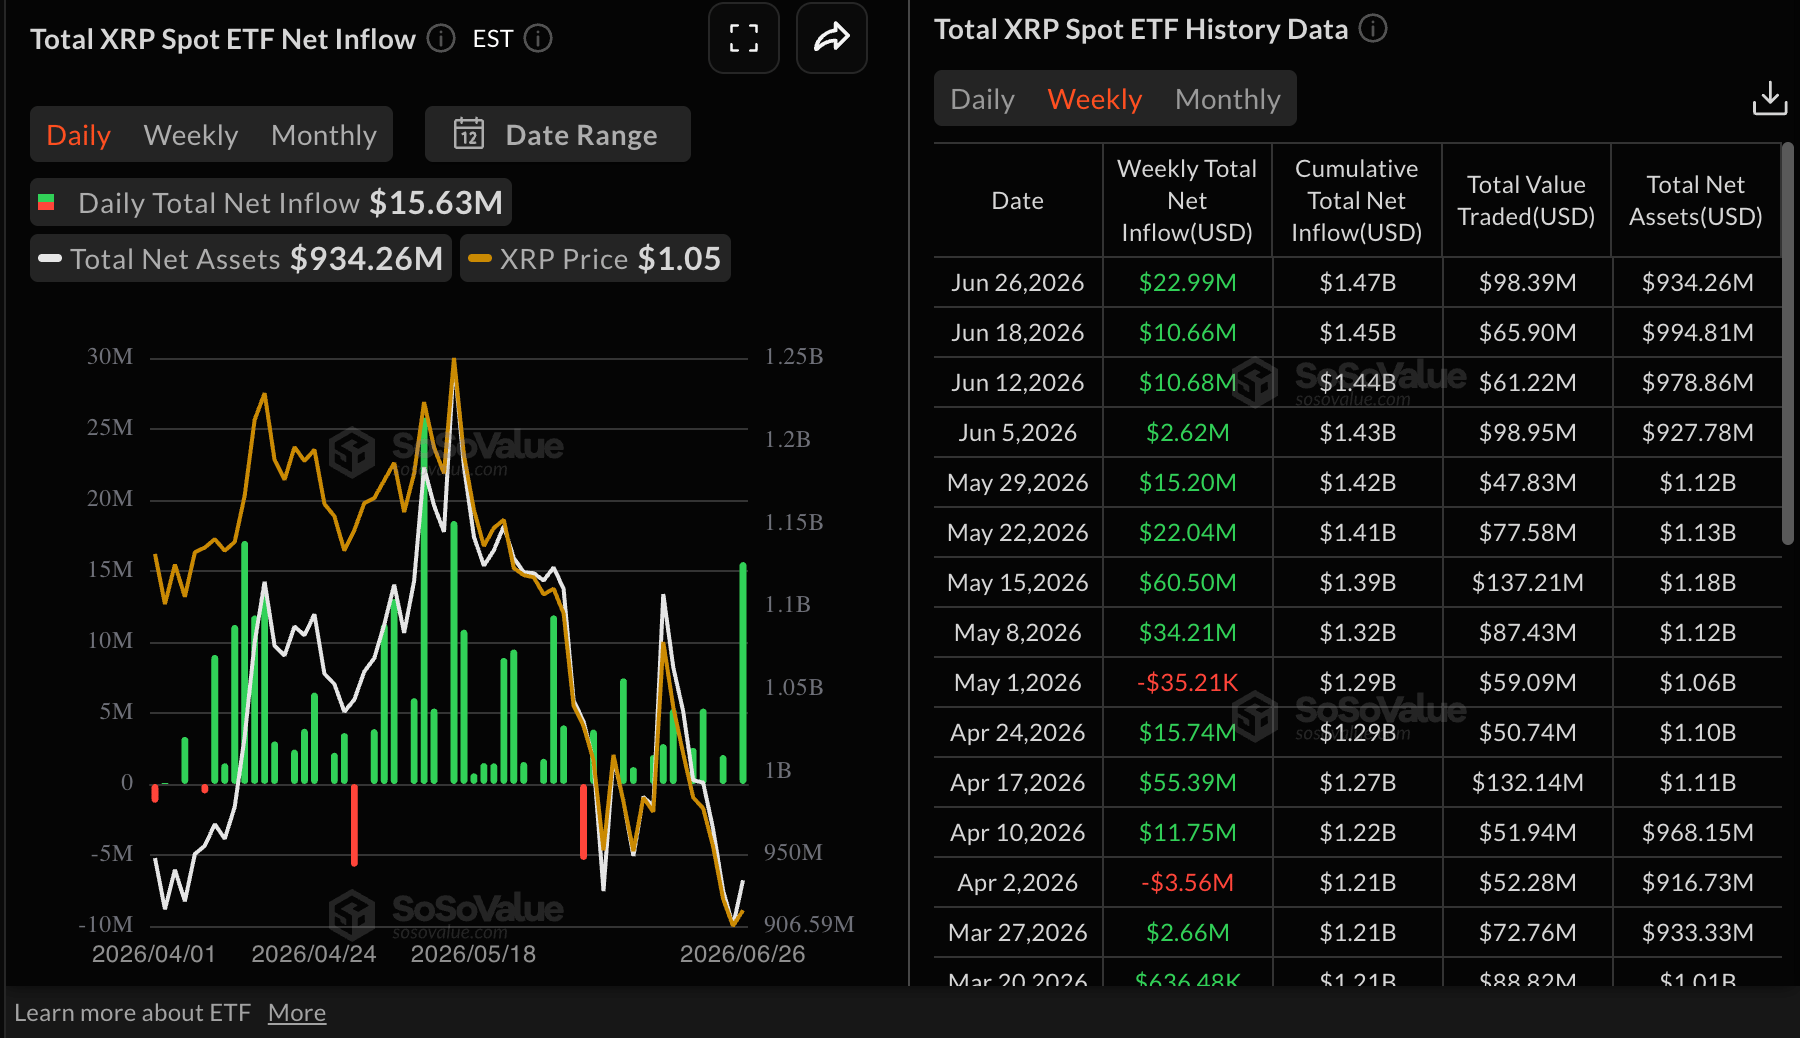
XRP spot Exchange-Traded Funds (ETFs) posted inflows on several days last week. According to SoSoValue data, US-listed spot ETF inflows more than doubled totalling to $23 million, up from nearly $11 million the previous week.
Cumulative inflows currently stand at $1.47 billion, up from the $1.45 billion recorded the week before, while assets under management dropped to $934 million from $995 million.
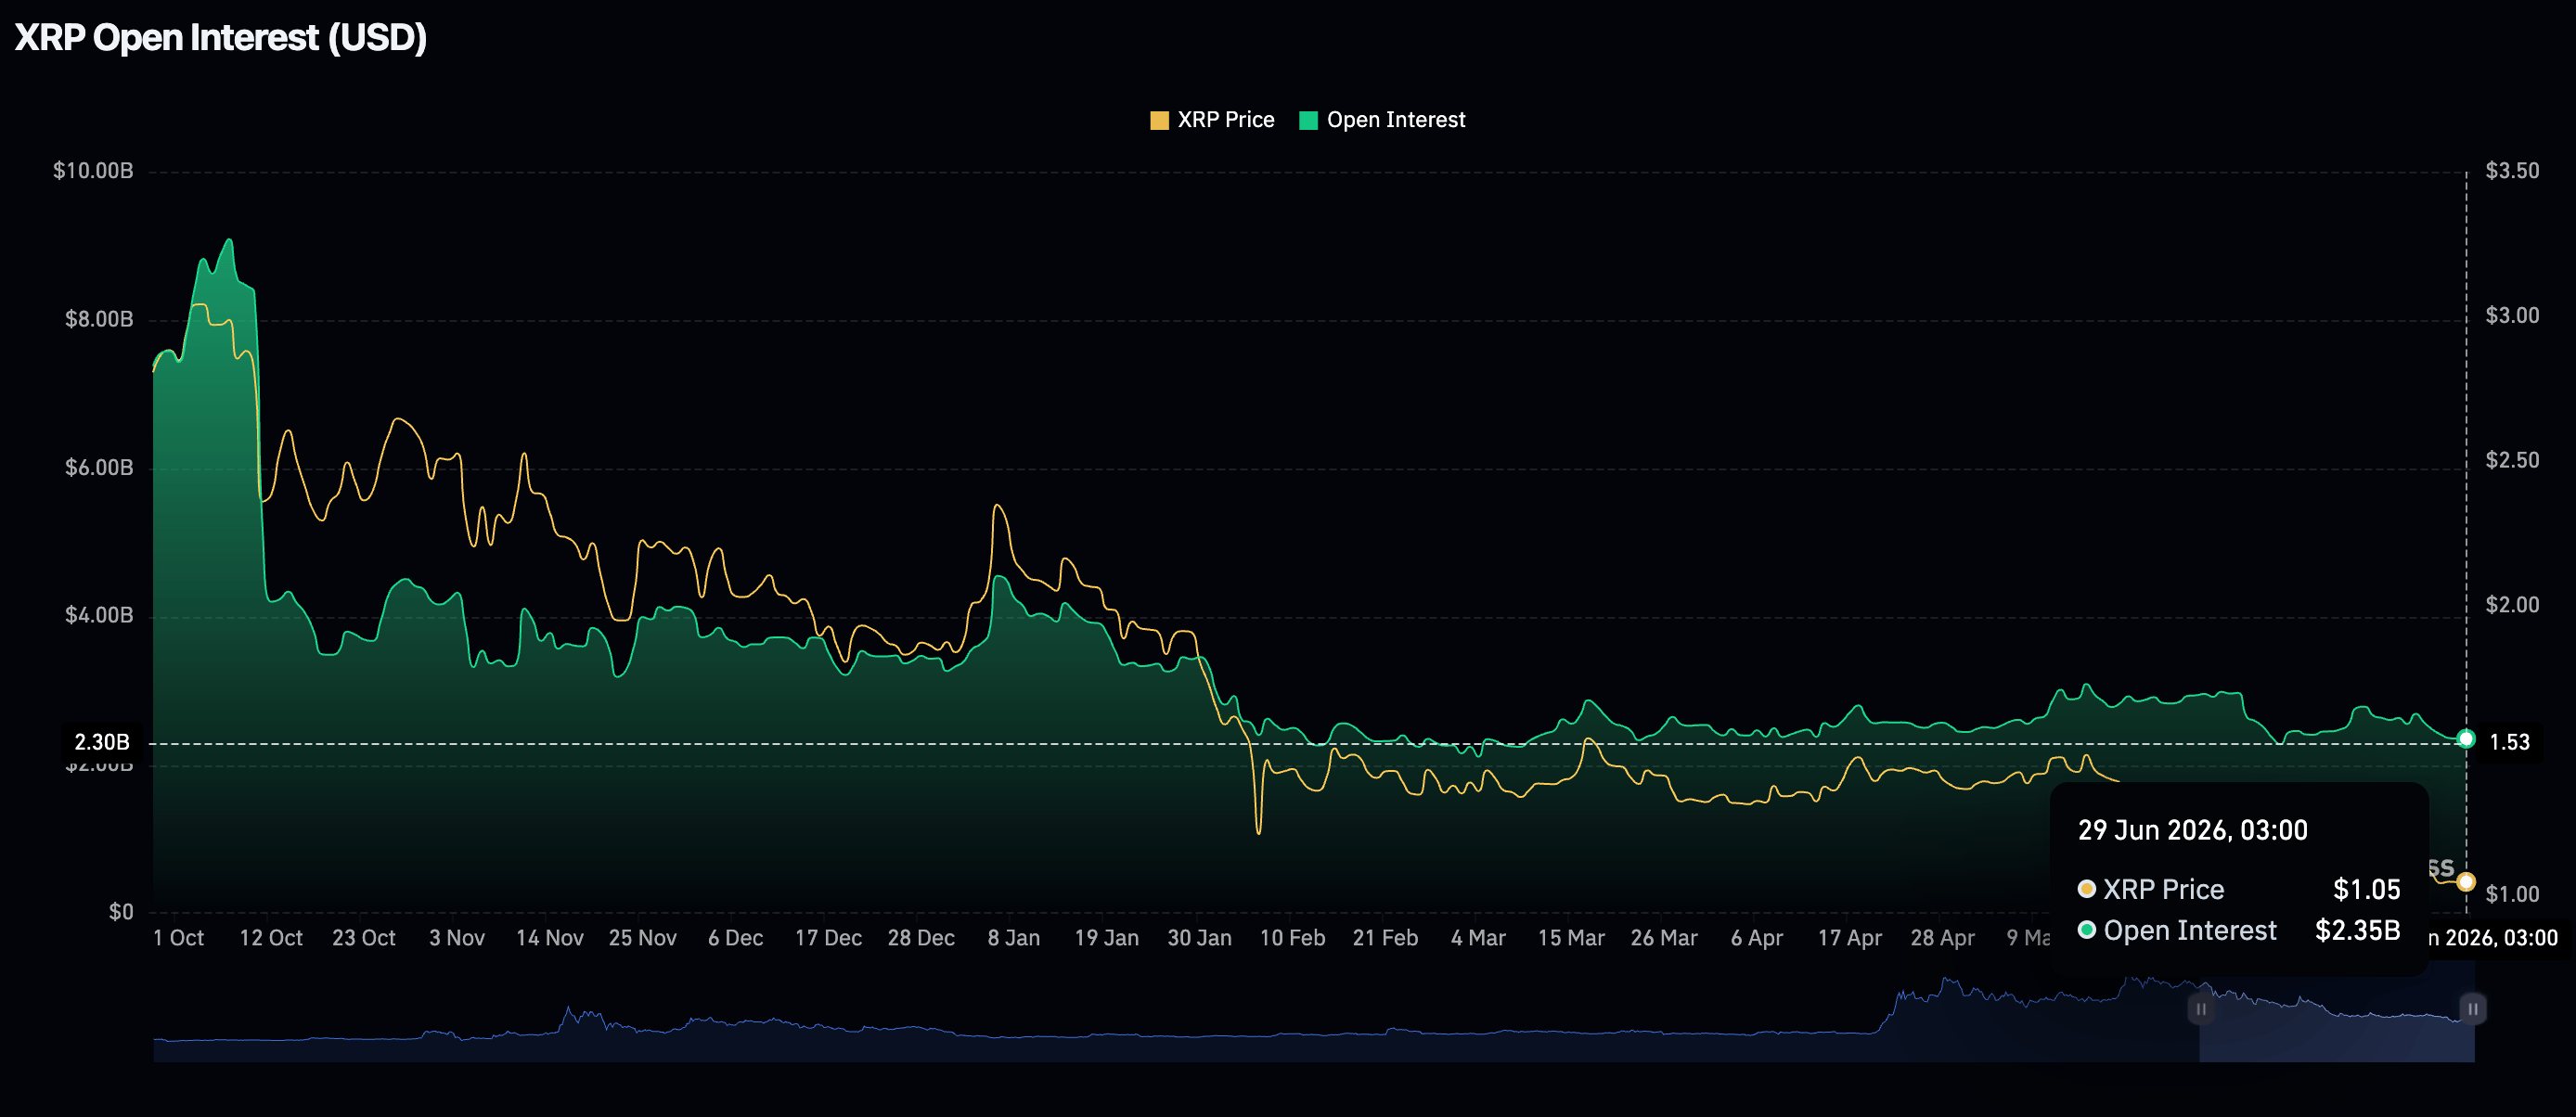
Steady institutional interest is required to offset a significantly suppressed retail market. CoinGlass data show that perpetual futures Open Interest (OI) has remained relatively stable at $2.36 billion, down from $2.69 billion on June 1. Compared to the record $10.94 billion in July, the current OI indicates that risk-averse sentiment dominates in the retail market. The return of retailers would be key for the resumption of the uptrend.
Price analysis: XRP holds key support amid a broader bearish trend
XRP trades at $1.05, keeping a clear bearish near-term tone as price holds well beneath the key Exponential Moving Averages (EMAs), with the 50-day EMA at $1.21, the 100-day EMA at $1.31 and the 200-day EMA at $1.53 all acting as overhead resistance.
The pair is also capped below the Bollinger Bands' middle boundary at $1.12, while the lower band near $1.01 offers the nearest technical floor.
Meanwhile, the Moving Average Convergence Divergence (MACD) histogram remains marginally negative and flat on the daily chart, while the Relative Strength Index (RSI) which sits at 33 sits, suggests subdued downside momentum.
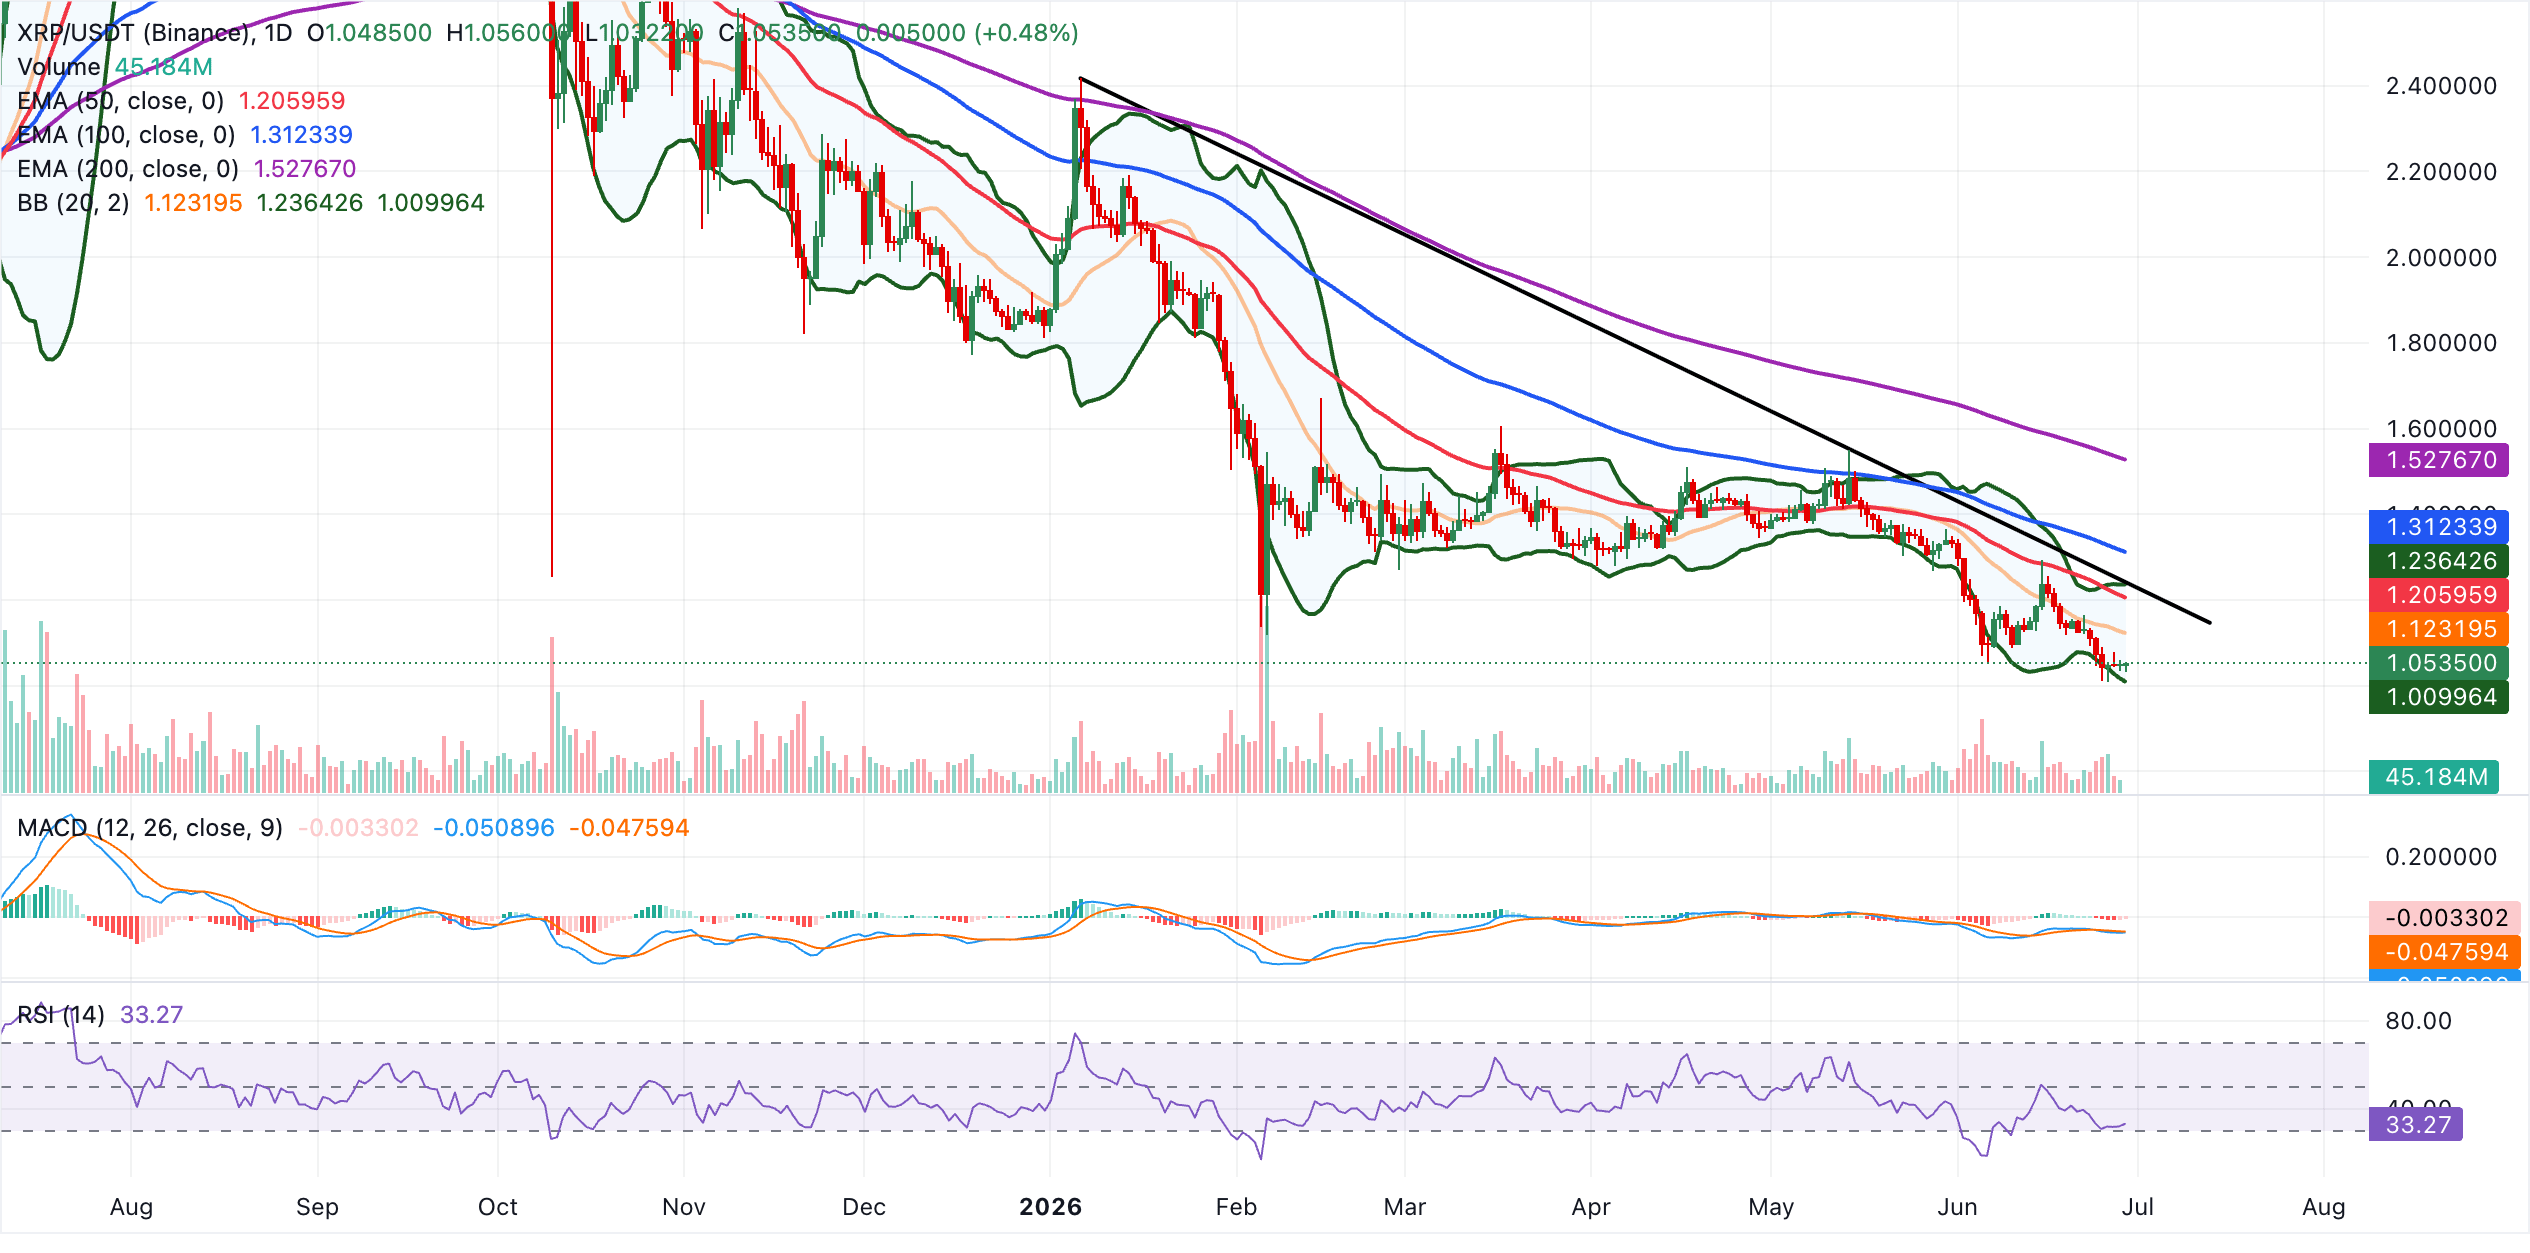
Initial resistance is seen at the Bollinger middle band around $1.12, ahead of a tighter cluster in the $1.23-$1.24 region where the Bollinger upper band aligns with the downward trendline’s break price. A daily close above this zone would be needed to ease the broader bearish pressure and target the 50-day EMA at $1.21 and. Further up, the 100-day EMA at $1.31 and the 200-day EMA at $1.53 would keep XRP constrained.
Looking down, immediate support is seen at the Bollinger lower band near $1.01. A decisive move below this level would expose fresh weakness, opening the door to a deeper retracement while keeping the overall structure firmly biased to the downside.
(The technical analysis of this story was written with the help of an AI tool.)
Crypto ETF FAQs
An Exchange-Traded Fund (ETF) is an investment vehicle or an index that tracks the price of an underlying asset. ETFs can not only track a single asset, but a group of assets and sectors. For example, a Bitcoin ETF tracks Bitcoin’s price. ETF is a tool used by investors to gain exposure to a certain asset.
Yes. The first Bitcoin futures ETF in the US was approved by the US Securities & Exchange Commission in October 2021. A total of seven Bitcoin futures ETFs have been approved, with more than 20 still waiting for the regulator’s permission. The SEC says that the cryptocurrency industry is new and subject to manipulation, which is why it has been delaying crypto-related futures ETFs for the last few years.
Yes. The SEC approved in January 2024 the listing and trading of several Bitcoin spot Exchange-Traded Funds, opening the door to institutional capital and mainstream investors to trade the main crypto currency. The decision was hailed by the industry as a game changer.
The main advantage of crypto ETFs is the possibility of gaining exposure to a cryptocurrency without ownership, reducing the risk and cost of holding the asset. Other pros are a lower learning curve and higher security for investors since ETFs take charge of securing the underlying asset holdings. As for the main drawbacks, the main one is that as an investor you can’t have direct ownership of the asset, or, as they say in crypto, “not your keys, not your coins.” Other disadvantages are higher costs associated with holding crypto since ETFs charge fees for active management. Finally, even though investing in ETFs reduces the risk of holding an asset, price swings in the underlying cryptocurrency are likely to be reflected in the investment vehicle too.

More than a million users rely on FXStreet for real-time market data, charting tools, expert insights, and forex news. Its comprehensive economic calendar and educational webinars help traders stay informed and make calculated decisions. FXStreet is supported by a team of about 60 professionals, split between the Barcelona headquarters and various global regions.
Read More


