




Silver Price Forecast: Could Fed decision trigger a break from $55-$62 range?
- Silver struggles below the 21-day SMA as prices remain trapped within a $55-$62 range.
- The RSI and MACD indicators point to near-term stabilization as selling pressure eases.
- A break above $62 could expose $65, while a close below $55 would bring $50 into focus.
Silver (XAG/USD) reverses part of its earlier gains on Monday as the US Dollar (USD) rebounds after opening the week with a bearish gap following a temporary pause in attacks between the United States (US) and Iran.

At the time of writing, XAG/USD trades around $58.34, up 0.37% on the day, after briefly climbing above $60 earlier during the Asian trading session.
XAG/USD has traded largely within a $55.00-$62.00 range in recent weeks, with hawkish Federal Reserve (Fed) expectations capping upside attempts.
Could Wednesday’s Fed interest-rate decision trigger Silver’s next directional move?
The US central bank is widely expected to keep rates unchanged at 3.50%-3.75%, although a surprise hike cannot be ruled out. According to the CME FedWatch Tool, traders price in around a 35% chance of an immediate increase.
A surprise rate hike would likely be the most bearish outcome for Silver. Higher interest rates would strengthen the US Dollar and push US Treasury yields higher, increasing the opportunity cost of holding non-yielding assets such as Silver. Such an outcome could trigger a break below the lower end of its recent range at $55.
A hawkish hold could also put the $55 support level at risk if Fed Chair Kevin Warsh emphasises persistent inflation concerns and signals that a rate hike later this year remains likely.
On the other hand, a dovish hold could provide relief for Silver, although it is not the base-case scenario. If the Fed adopts a less hawkish tone than markets expect, traders could scale back rate-hike expectations, increasing the chances of a recovery above $62.
Technical analysis
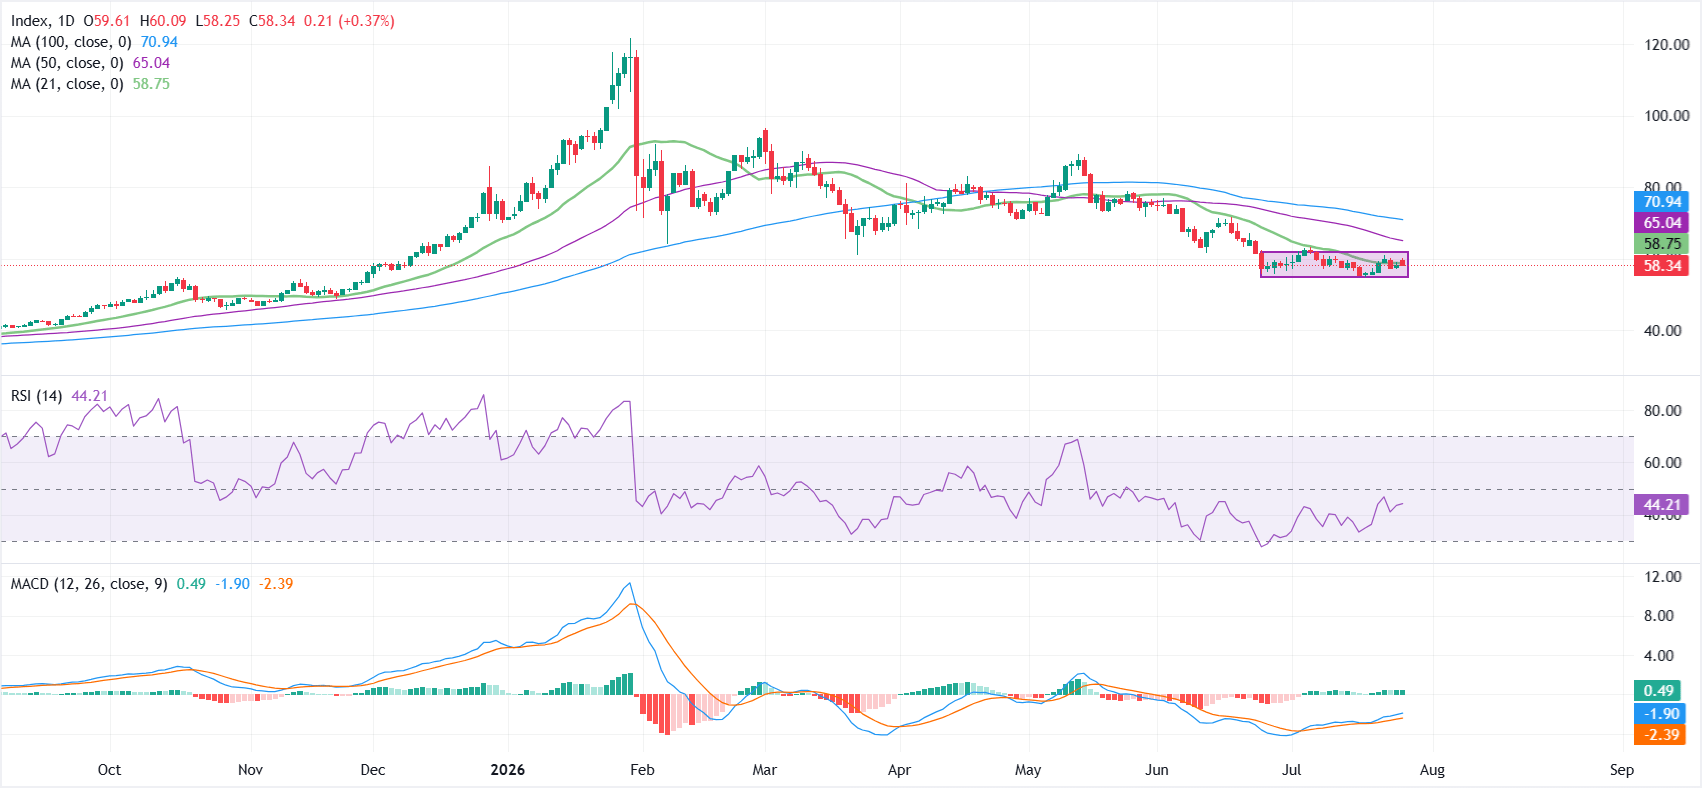
On the daily chart, XAG/USD retains a bearish bias despite showing signs of stabilization. Buyers are struggling near the 21-day Simple Moving Average (SMA) at $58.75.
Momentum shows tentative improvement, as the Relative Strength Index (RSI) recovers toward the mid-40s and the Moving Average Convergence Divergence (MACD) indicator holds in positive territory, hinting that selling pressure is losing intensity rather than that a bullish reversal is underway.
The 21-day SMA at $58.75 offers immediate resistance, followed by $62, the upper boundary of the recent range. A decisive break above this level could expose the 50-day SMA at $65, followed by the 100-day SMA at $70.94.
On the downside, $55.00 provides initial support. A daily close below this level could open the door toward the psychological $50 mark.
(The technical analysis of this story was written with the help of an AI tool. Know more.)
Fed FAQs
Monetary policy in the US is shaped by the Federal Reserve (Fed). The Fed has two mandates: to achieve price stability and foster full employment. Its primary tool to achieve these goals is by adjusting interest rates. When prices are rising too quickly and inflation is above the Fed’s 2% target, it raises interest rates, increasing borrowing costs throughout the economy. This results in a stronger US Dollar (USD) as it makes the US a more attractive place for international investors to park their money. When inflation falls below 2% or the Unemployment Rate is too high, the Fed may lower interest rates to encourage borrowing, which weighs on the Greenback.
The Federal Reserve (Fed) holds eight policy meetings a year, where the Federal Open Market Committee (FOMC) assesses economic conditions and makes monetary policy decisions. The FOMC is attended by twelve Fed officials – the seven members of the Board of Governors, the president of the Federal Reserve Bank of New York, and four of the remaining eleven regional Reserve Bank presidents, who serve one-year terms on a rotating basis.
In extreme situations, the Federal Reserve may resort to a policy named Quantitative Easing (QE). QE is the process by which the Fed substantially increases the flow of credit in a stuck financial system. It is a non-standard policy measure used during crises or when inflation is extremely low. It was the Fed’s weapon of choice during the Great Financial Crisis in 2008. It involves the Fed printing more Dollars and using them to buy high grade bonds from financial institutions. QE usually weakens the US Dollar.
Quantitative tightening (QT) is the reverse process of QE, whereby the Federal Reserve stops buying bonds from financial institutions and does not reinvest the principal from the bonds it holds maturing, to purchase new bonds. It is usually positive for the value of the US Dollar.










