
Trade The World
Top 3 Price Prediction: Bitcoin, Ethereum, Ripple – Bulls take charge, eye $100K BTC, $3,500 ETH and $2.35 XRP
By Manish Chhetri
Date Published: 14 Jan 2026 | Date Modified: 14 Jan 2026


POPULAR ARTICLES

Bitcoin (BTC), Ethereum (ETH) and Ripple (XRP) trade in green on Wednesday after rallying more than 4%, 7% and 5%, respectively, the previous day. BTC closed above key resistance, while ETH and XRP found support at key levels.
- Bitcoin is trading above $95,000 on Wednesday, after closing above the key resistance zone.
- Ethereum price extends gains, trading above $3,300 after rallying nearly 7% so far this week.
- XRP rebounds, finding support around its 50-day EMA at $2.17, suggesting continuation of the upside move.
Bitcoin (BTC), Ethereum (ETH) and Ripple (XRP) trade in green on Wednesday after rallying more than 4%, 7% and 5%, respectively, the previous day. BTC closed above key resistance, while ETH and XRP found support at key levels. The top three cryptocurrencies by market capitalization could extend their ongoing upside moves, targeting $100,000 BTC, $3,500 ETH, and $2.35 XRP.
Bitcoin closes above key resistance at $94,253
Bitcoin price found support around a previously broken upper consolidation zone at $90,000 on January 8 and recovered slightly through Monday. On Tuesday, BTC rose more than 4% and closed above the 61.8% Fibonacci retracement level (from the April low of $74,508 to October's all-time high of $126,199) at $94,253. As of Wednesday, BTC is trading around $95,300.
If BTC continues its rally, it could extend the surge toward the key psychological $100,000 level.
The Relative Strength Index (RSI) on the daily chart is 66, above the neutral level of 50 and trending upward, indicating bullish momentum is gaining traction. Moreover, the Moving Average Convergence Divergence (MACD) shows a bullish crossover that remains intact, with rising green histogram bars above the neutral level, further supporting the positive outlook.
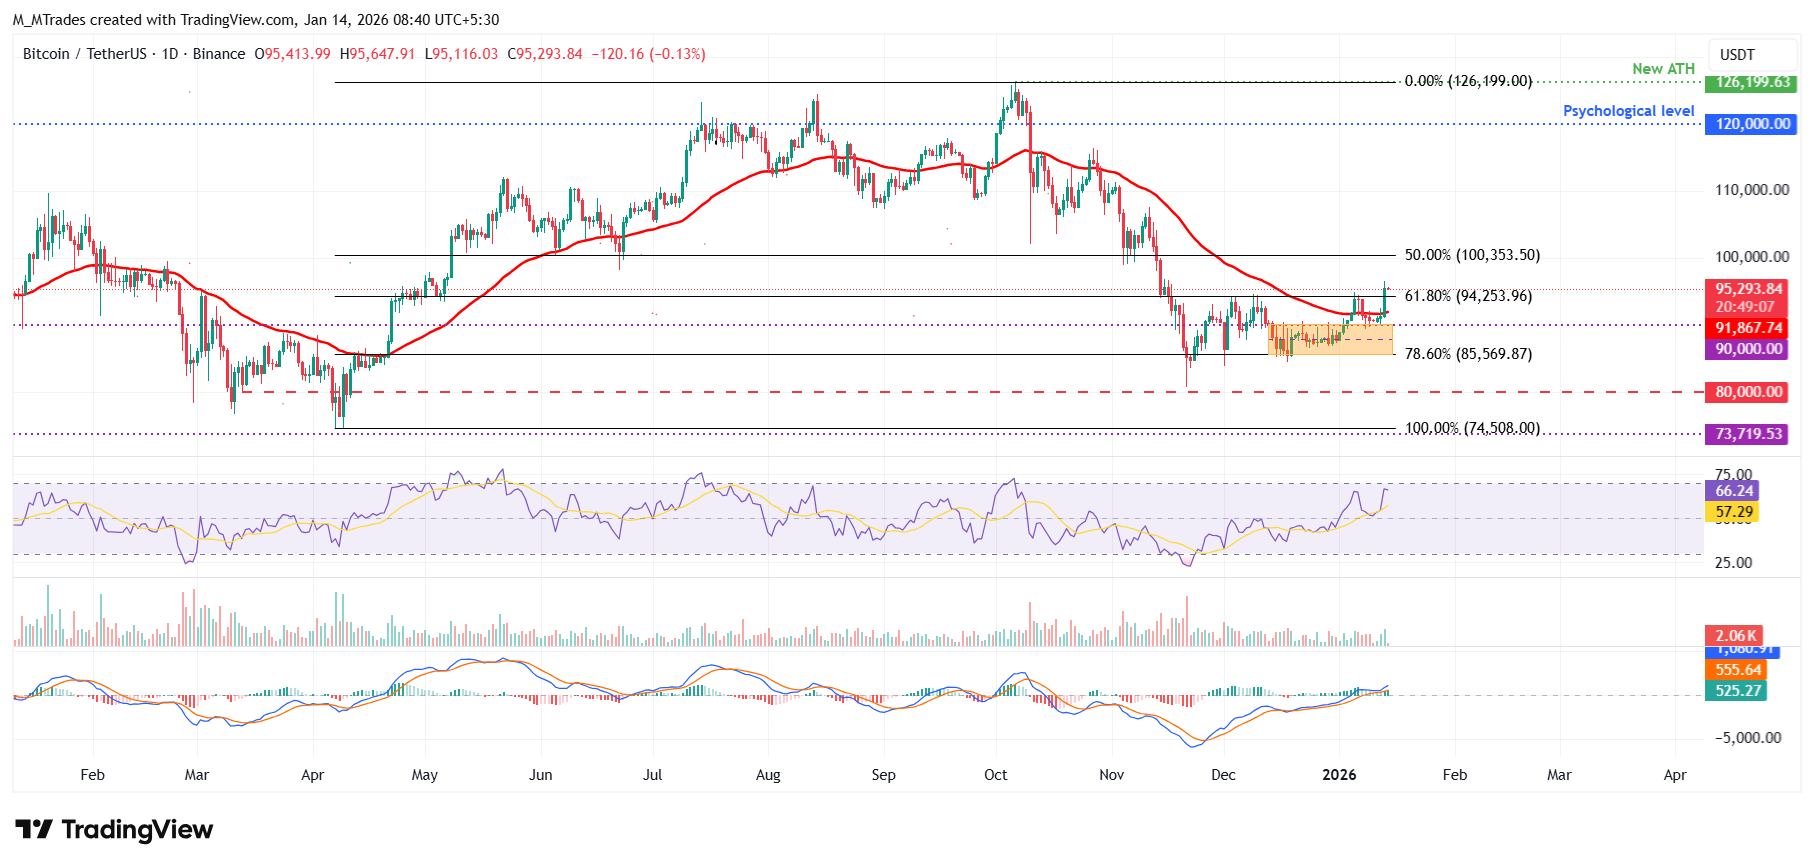
On the other hand, if BTC faces a correction, it could extend the decline toward the key support at $94,253.
Ethereum rebounds after retesting 50-day EMA
Ethereum price found support around the 50-day EMA at $3,139 last week and hovered around this zone throughout Monday. On Tuesday, ETH rose more than 7% and closed above $3,325. As of Wednesday, ETH is trading at around $3,200.
If ETH continues its upward momentum, it could extend the rally toward the December 10 high of $3,447.
Like Bitcoin, Ethereum’s RSI and MACD indicators signal bullishness, further supporting a positive view.
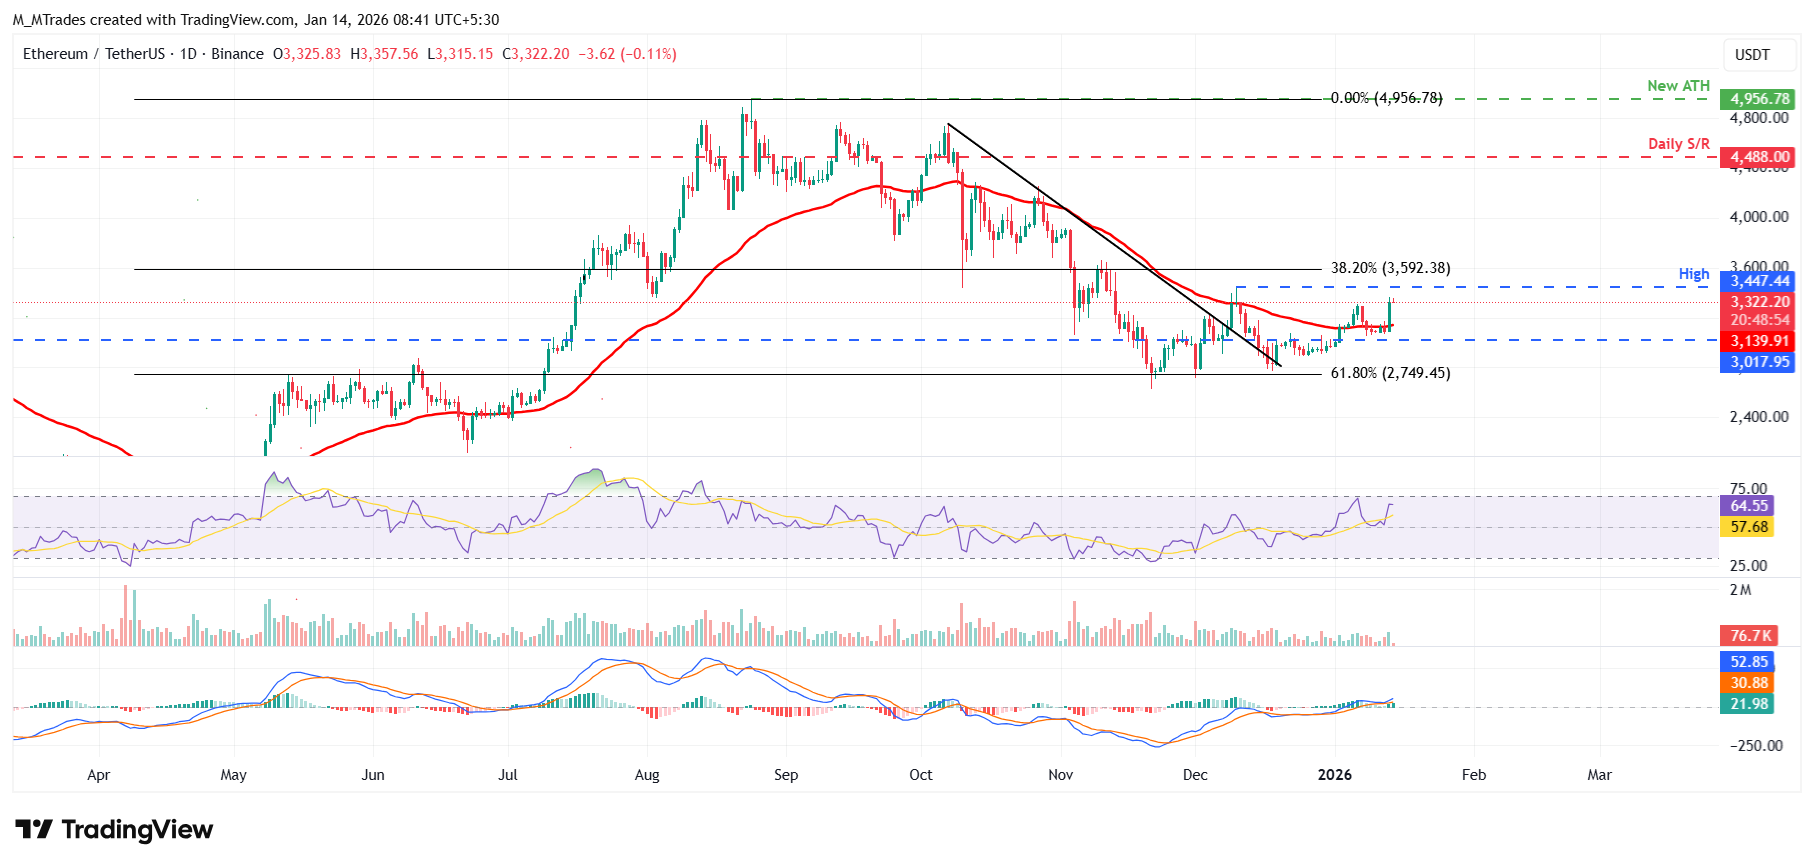
However, if ETH faces a correction, it could extend the decline toward the 50-day EMA at $3,139.
XRP bulls aiming for the $2.35 mark
XRP price found support around the 50-day EMA at $2.07 last week and hovered around this zone throughout Monday. On Tuesday, XRP rose more than 5%. At the time of writing on Wednesday, XRP is trading at around $2.16.
If XRP continues its rally, it could extend the surge toward the daily resistance level at $2.35.
Like Bitcoin and Ethereum, XRP momentum indicators (RSI and MACD) showed bullish signals and support a positive outlook.
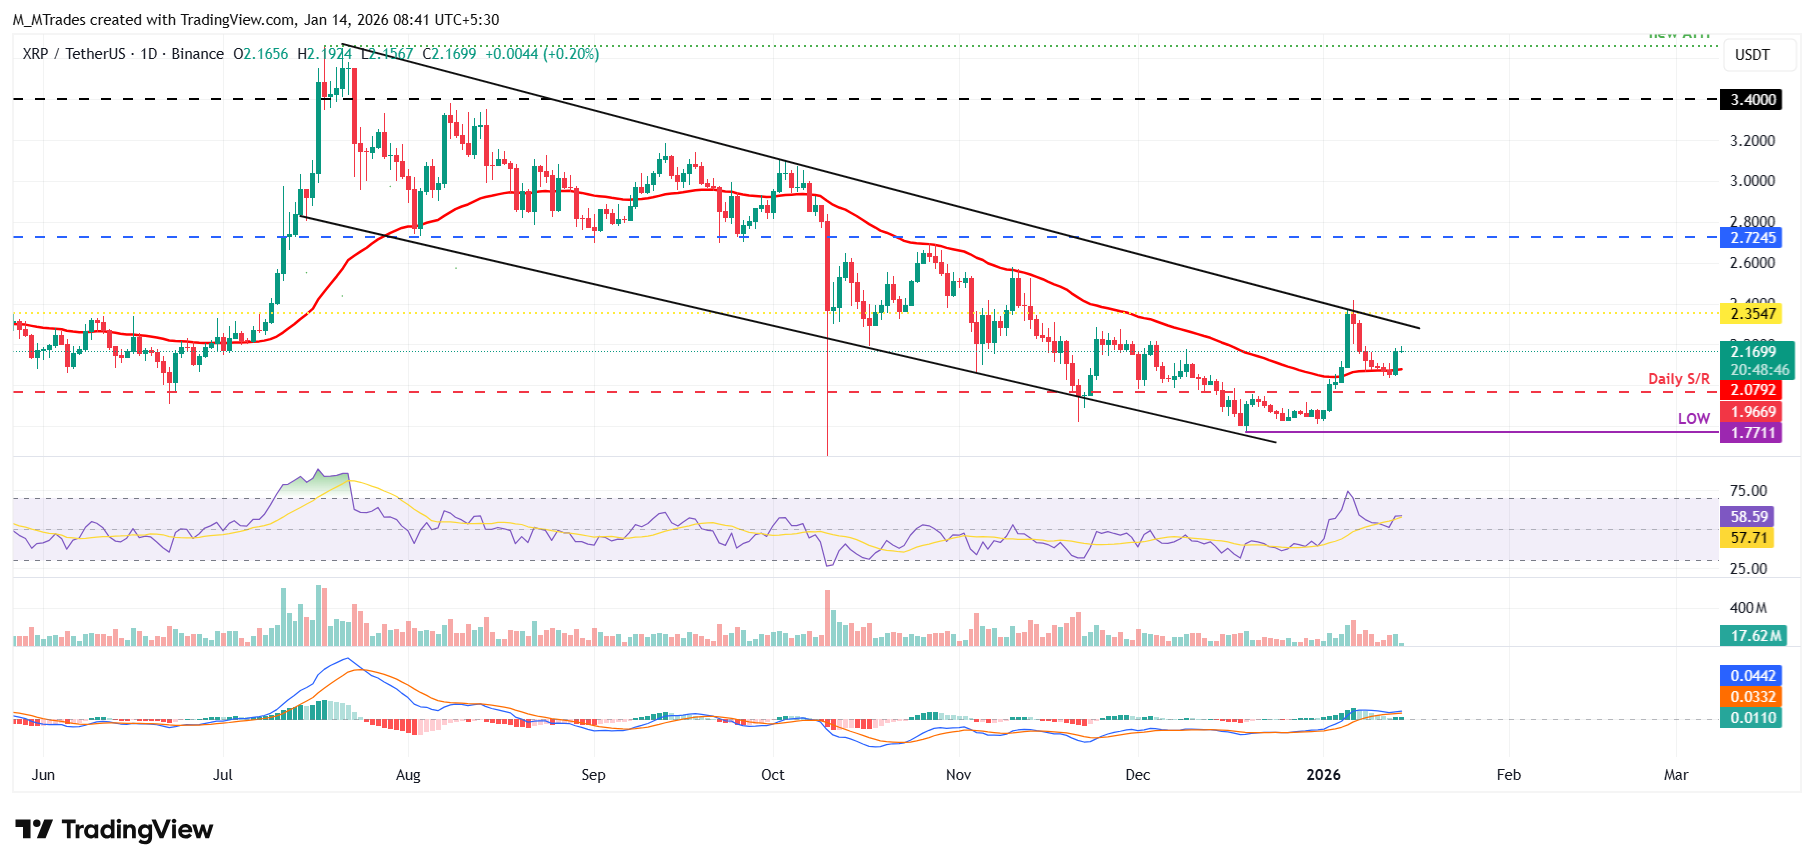
On the other hand, if XRP faces a pullback, it could extend the decline toward the 50-day EMA at $2.07.
Cryptocurrency metrics FAQs
The developer or creator of each cryptocurrency decides on the total number of tokens that can be minted or issued. Only a certain number of these assets can be minted by mining, staking or other mechanisms. This is defined by the algorithm of the underlying blockchain technology. On the other hand, circulating supply can also be decreased via actions such as burning tokens, or mistakenly sending assets to addresses of other incompatible blockchains.
Market capitalization is the result of multiplying the circulating supply of a certain asset by the asset’s current market value.
Trading volume refers to the total number of tokens for a specific asset that has been transacted or exchanged between buyers and sellers within set trading hours, for example, 24 hours. It is used to gauge market sentiment, this metric combines all volumes on centralized exchanges and decentralized exchanges. Increasing trading volume often denotes the demand for a certain asset as more people are buying and selling the cryptocurrency.
Funding rates are a concept designed to encourage traders to take positions and ensure perpetual contract prices match spot markets. It defines a mechanism by exchanges to ensure that future prices and index prices periodic payments regularly converge. When the funding rate is positive, the price of the perpetual contract is higher than the mark price. This means traders who are bullish and have opened long positions pay traders who are in short positions. On the other hand, a negative funding rate means perpetual prices are below the mark price, and hence traders with short positions pay traders who have opened long positions.

FXStreet
More than a million users rely on FXStreet for real-time market data, charting tools, expert insights, and forex news. Its comprehensive economic calendar and educational webinars help traders stay informed and make calculated decisions. FXStreet is supported by a team of about 60 professionals, split between the Barcelona headquarters and various global regions.
Read More


