
XRP price falls with no recovery in sight as investor confidence declines
By Vishal Dixit
Date Published: 20 Jan 2026 | Date Modified: 20 Jan 2026


POPULAR ARTICLES

Ripple (XRP) builds on the prevailing downtrend, recording 3% drop at press time on Tuesday. Growing pressure on medium-term XRP holders and a drop in XRP futures Open Interest strengthen the downside bias. Technically, XRP approaches a deeper support zone as selling pressure mounts.
- XRP is down 3% so far on Tuesday, extending below $2, its seven-day decline.
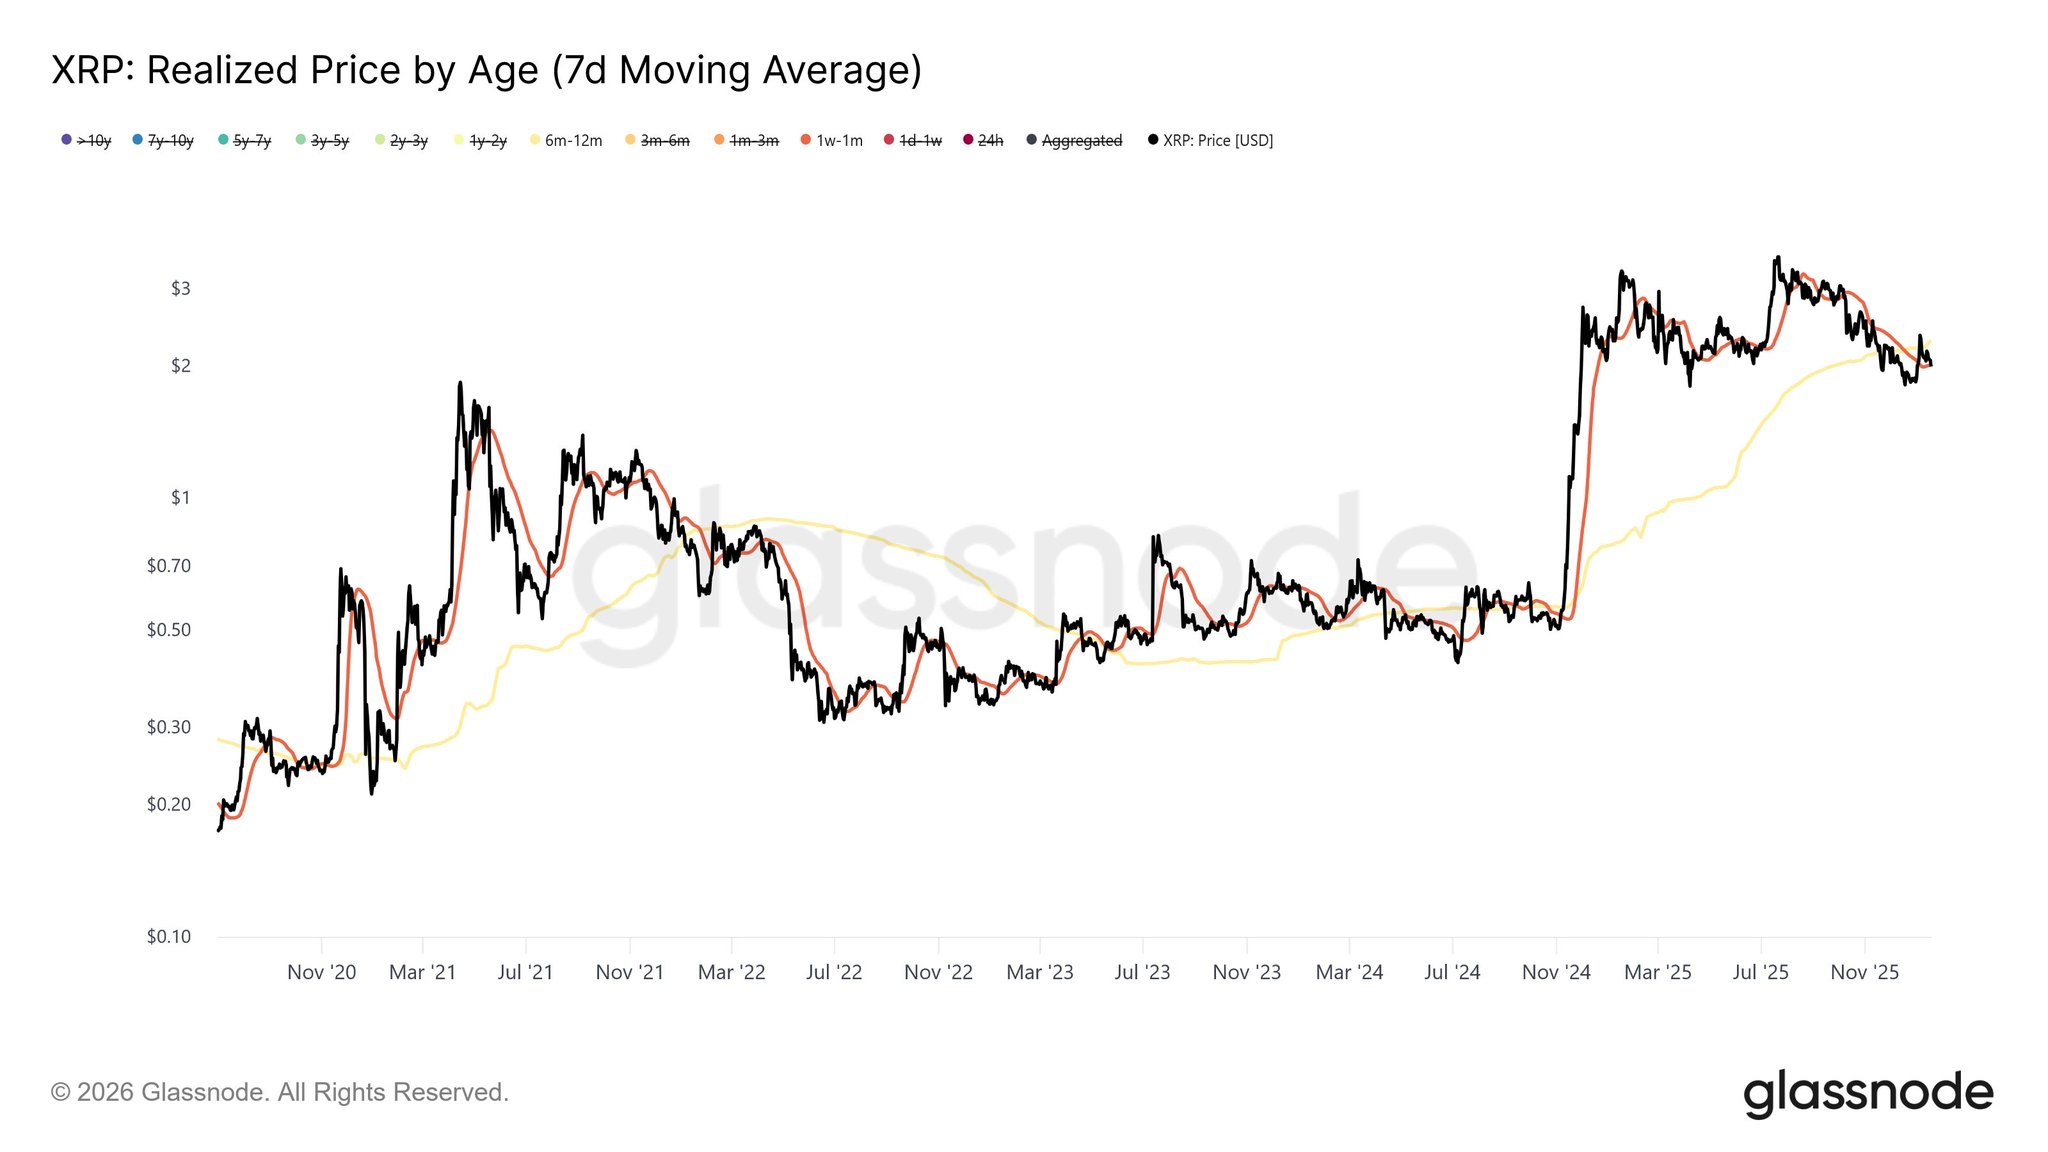
- Glassnode data shows medium-term holders under pressure, mirroring the February 2022 cycle top structure.
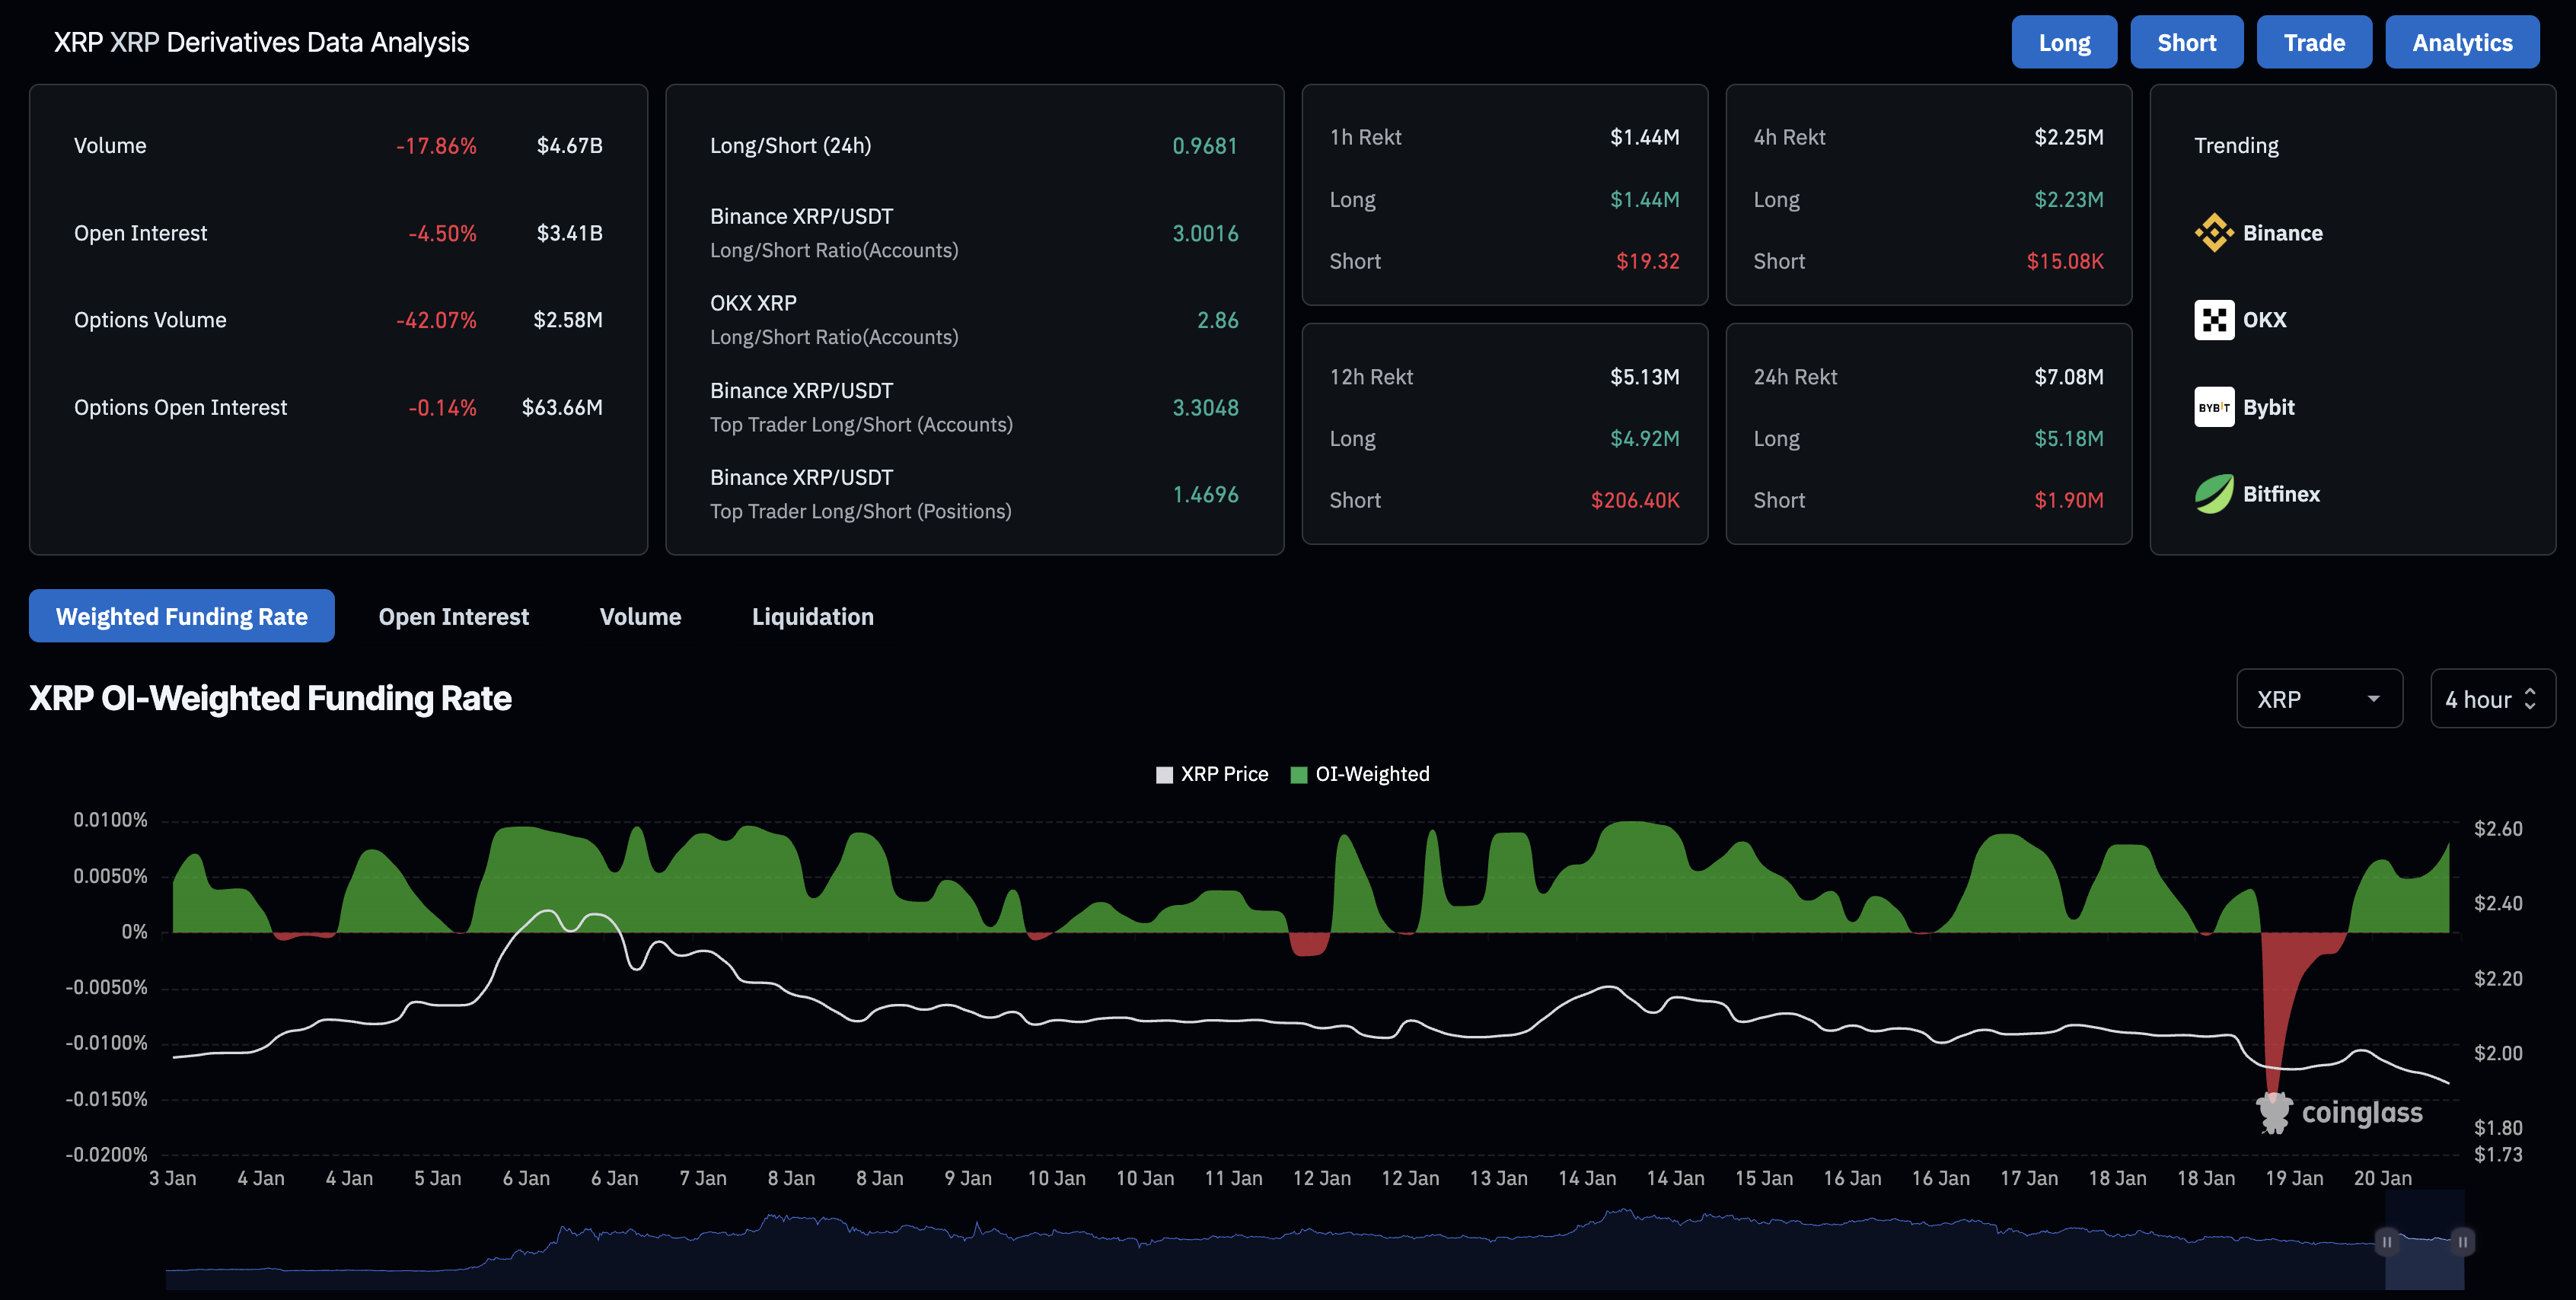
- Derivatives data indicate declining retail interest as XRP futures Open Interest falls to $3.41 billion.
Ripple (XRP) builds on the prevailing downtrend, recording 3% drop at press time on Tuesday. Growing pressure on medium-term XRP holders and a drop in XRP futures Open Interest strengthen the downside bias. Technically, XRP approaches a deeper support zone as selling pressure mounts.
XRP holders’ confidence at risk
On-chain holders' activity reveals a downside risk in XRP similar to the February 2022 market structure, which preceded a 60% decline in the summer of 2022. At the time of writing, the average cost basis of short-term XRP holders (1 week to 1 month) has fallen below the realized price of medium-term holders (6 months to a year). This indicates that the older cohort is underwater, and the reduced cost basis of short-term chasers adds to the pressure.
Meanwhile, the XRP futures Open Interest (OI) has dropped 4.50% over the last 24 hours, reaching $3.41 billion. Decaying OI refers to the decline in the value of outstanding futures contracts as traders become risk-averse.
Consistent with reduced interest, long liquidations of $5.18 million outpace short liquidations of $1.90 million over the last 24 hours, reflecting a massive wipeout of bullish-aligned traders in XRP futures.
Technical outlook: Will XRP extend the fall to $1.85?
XRP price remains below the 20-period Exponential Moving Average (EMA) on the 4-hour logarithmic chart at $2.00 and the 50-period EMA at $2.04. Both moving averages are sloping lower, underscoring a bearish setup. Additionally, the 50-period EMA crosses below the 200-period EMA, marking a Death Cross pattern and reinforcing the downside bias.
A steady decline in XRP below the S1 Pivot Point at $1.92 could test the support trendline connecting the January 5 and 8 lows, near $1.89, followed by a deeper zone at the S2 Pivot Point at $1.85.
The Moving Average Convergence Divergence (MACD) on the 4-hour chart continues to fall below the red line, with the negative histogram widening, suggesting intense bearish momentum. The Relative Strength Index (RSI) on the same chart is at 29, indicating an oversold condition and confirming an intense sell-side impulse.
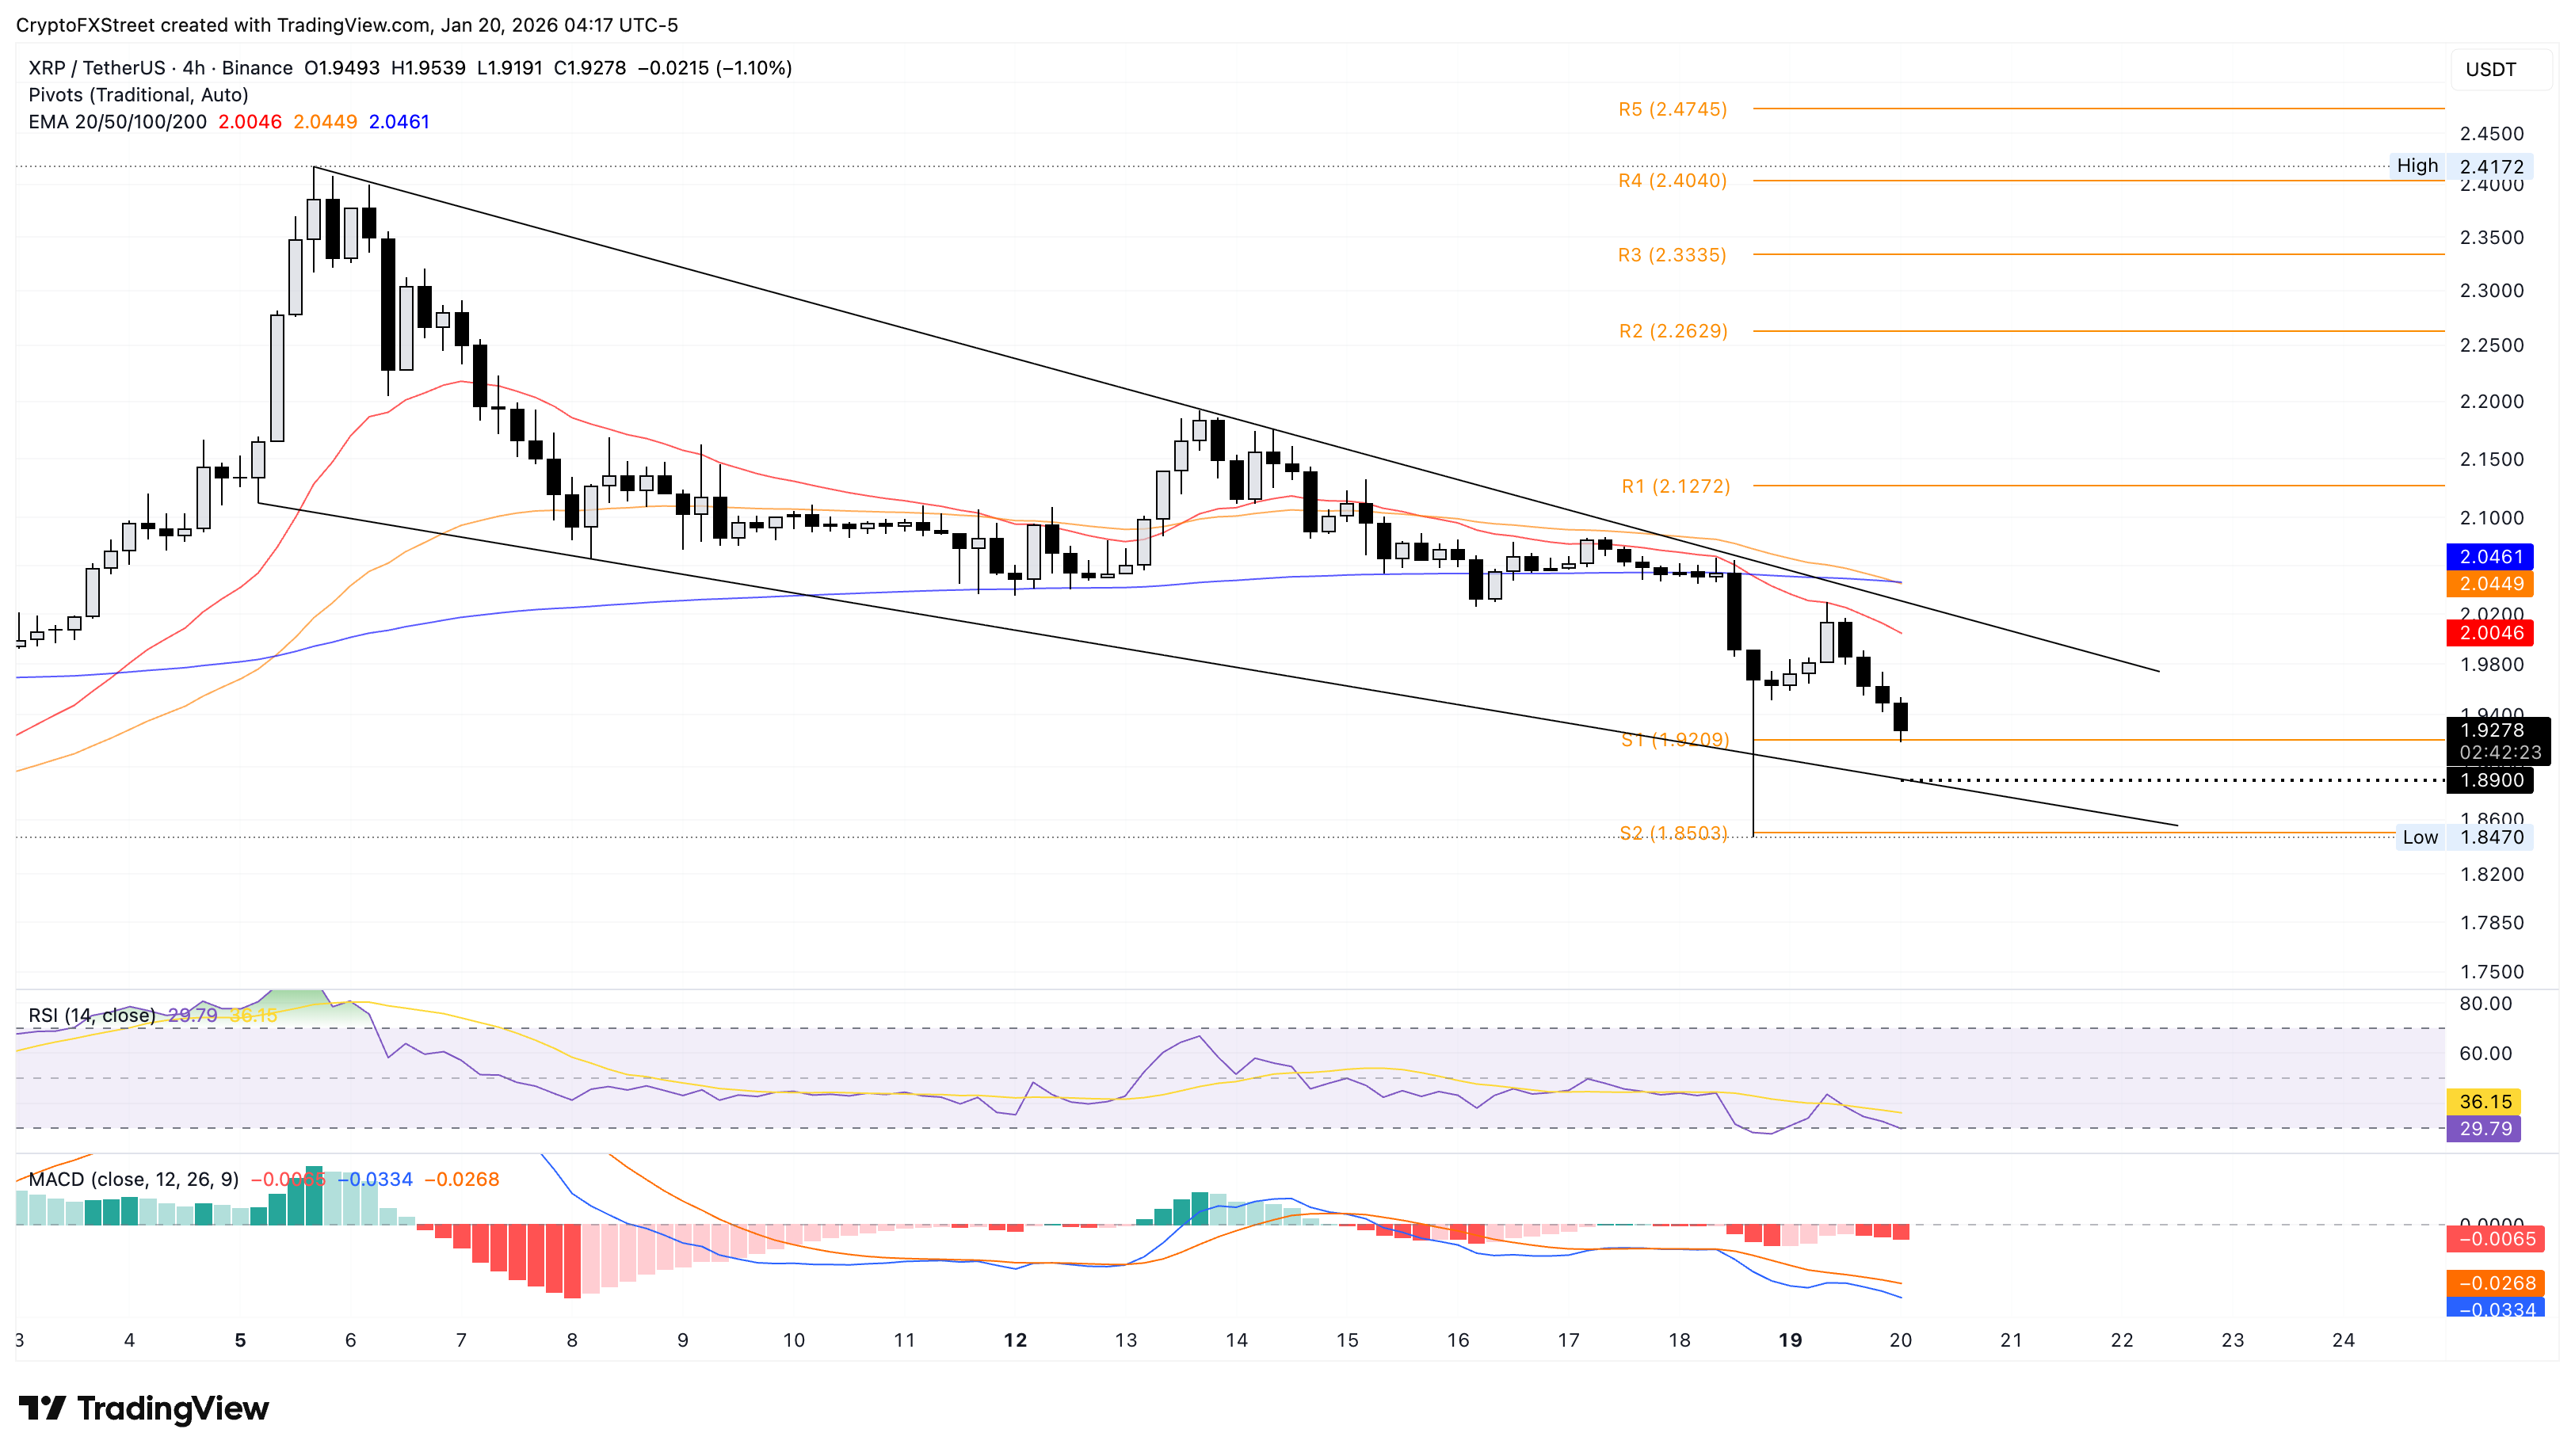
Considering the MACD is anchored in negative territory and the RSI subdued, XRP bulls would need a decisive close above the descending trendline connecting the January 5 and 13 highs near $2.03 and the 200-period EMA at $2.04 to flip the momentum. This could open the door toward the R1 Pivot Point at $2.12.
(The technical analysis of this story was written with the help of an AI tool.)

More than a million users rely on FXStreet for real-time market data, charting tools, expert insights, and forex news. Its comprehensive economic calendar and educational webinars help traders stay informed and make calculated decisions. FXStreet is supported by a team of about 60 professionals, split between the Barcelona headquarters and various global regions.
Read More


