
Pi Network Price Analysis: Bulls hold above key support as bearish pressure builds
By Vishal Dixit
Date Published: 25 Feb 2026 | Date Modified: 25 Feb 2026


POPULAR ARTICLES
Pi Network (PI) holds broadly steady above $0.1600 at press time on Wednesday after a nearly 2% rebound the previous day.
- Pi Network holds above a crucial support level at $0.1533 after falling below the 50-day EMA.
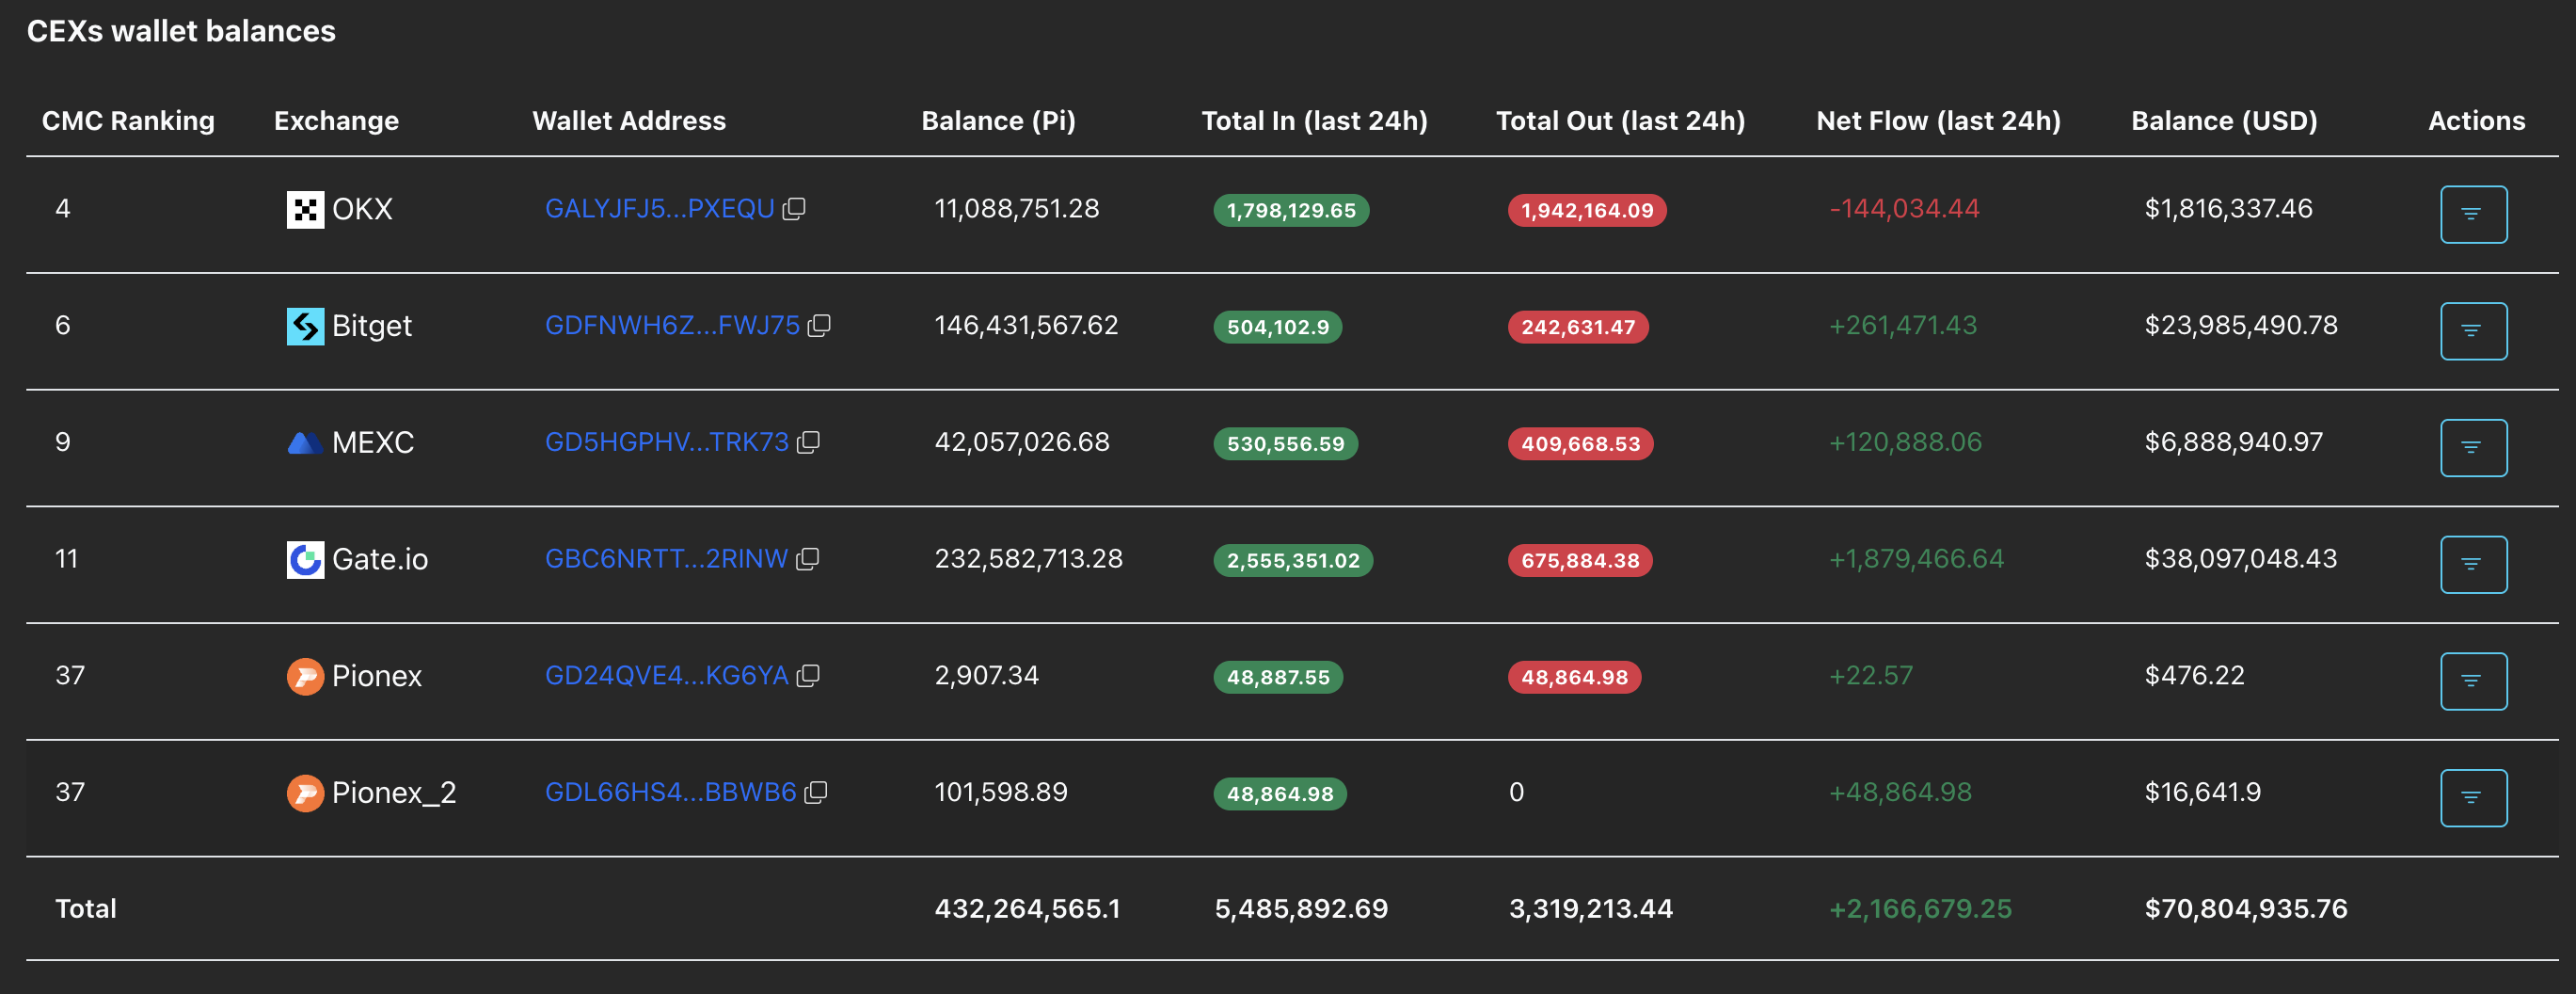
- PiScan data shows a large increase in deposits on exchanges ahead of a 32 million token unlock, fueling the selling pressure.
- The technical outlook is skewed bearish as buying pressure wanes.
Pi Network (PI) holds broadly steady above $0.1600 at press time on Wednesday after a nearly 2% rebound the previous day. Despite the recent advance, selling pressure is growing in Pi Network, with more than 2 million PI tokens deposited on exchanges and over 32 million PI tokens still to be unlocked this week. The technical outlook for PI highlights downside risk as pressure persists over the $0.1533 support level.
Supply pressure weighs down Pi Network
PiScan data shows that 2.16 million PI tokens were deposited on Centralized Exchanges (CEXS) over the past 24 hours, bringing centralized exchange holdings to over 432 million PI tokens, worth $70.80 million. This significant inflow reaffirms declining investor confidence in PI, adding to the selling pressure.
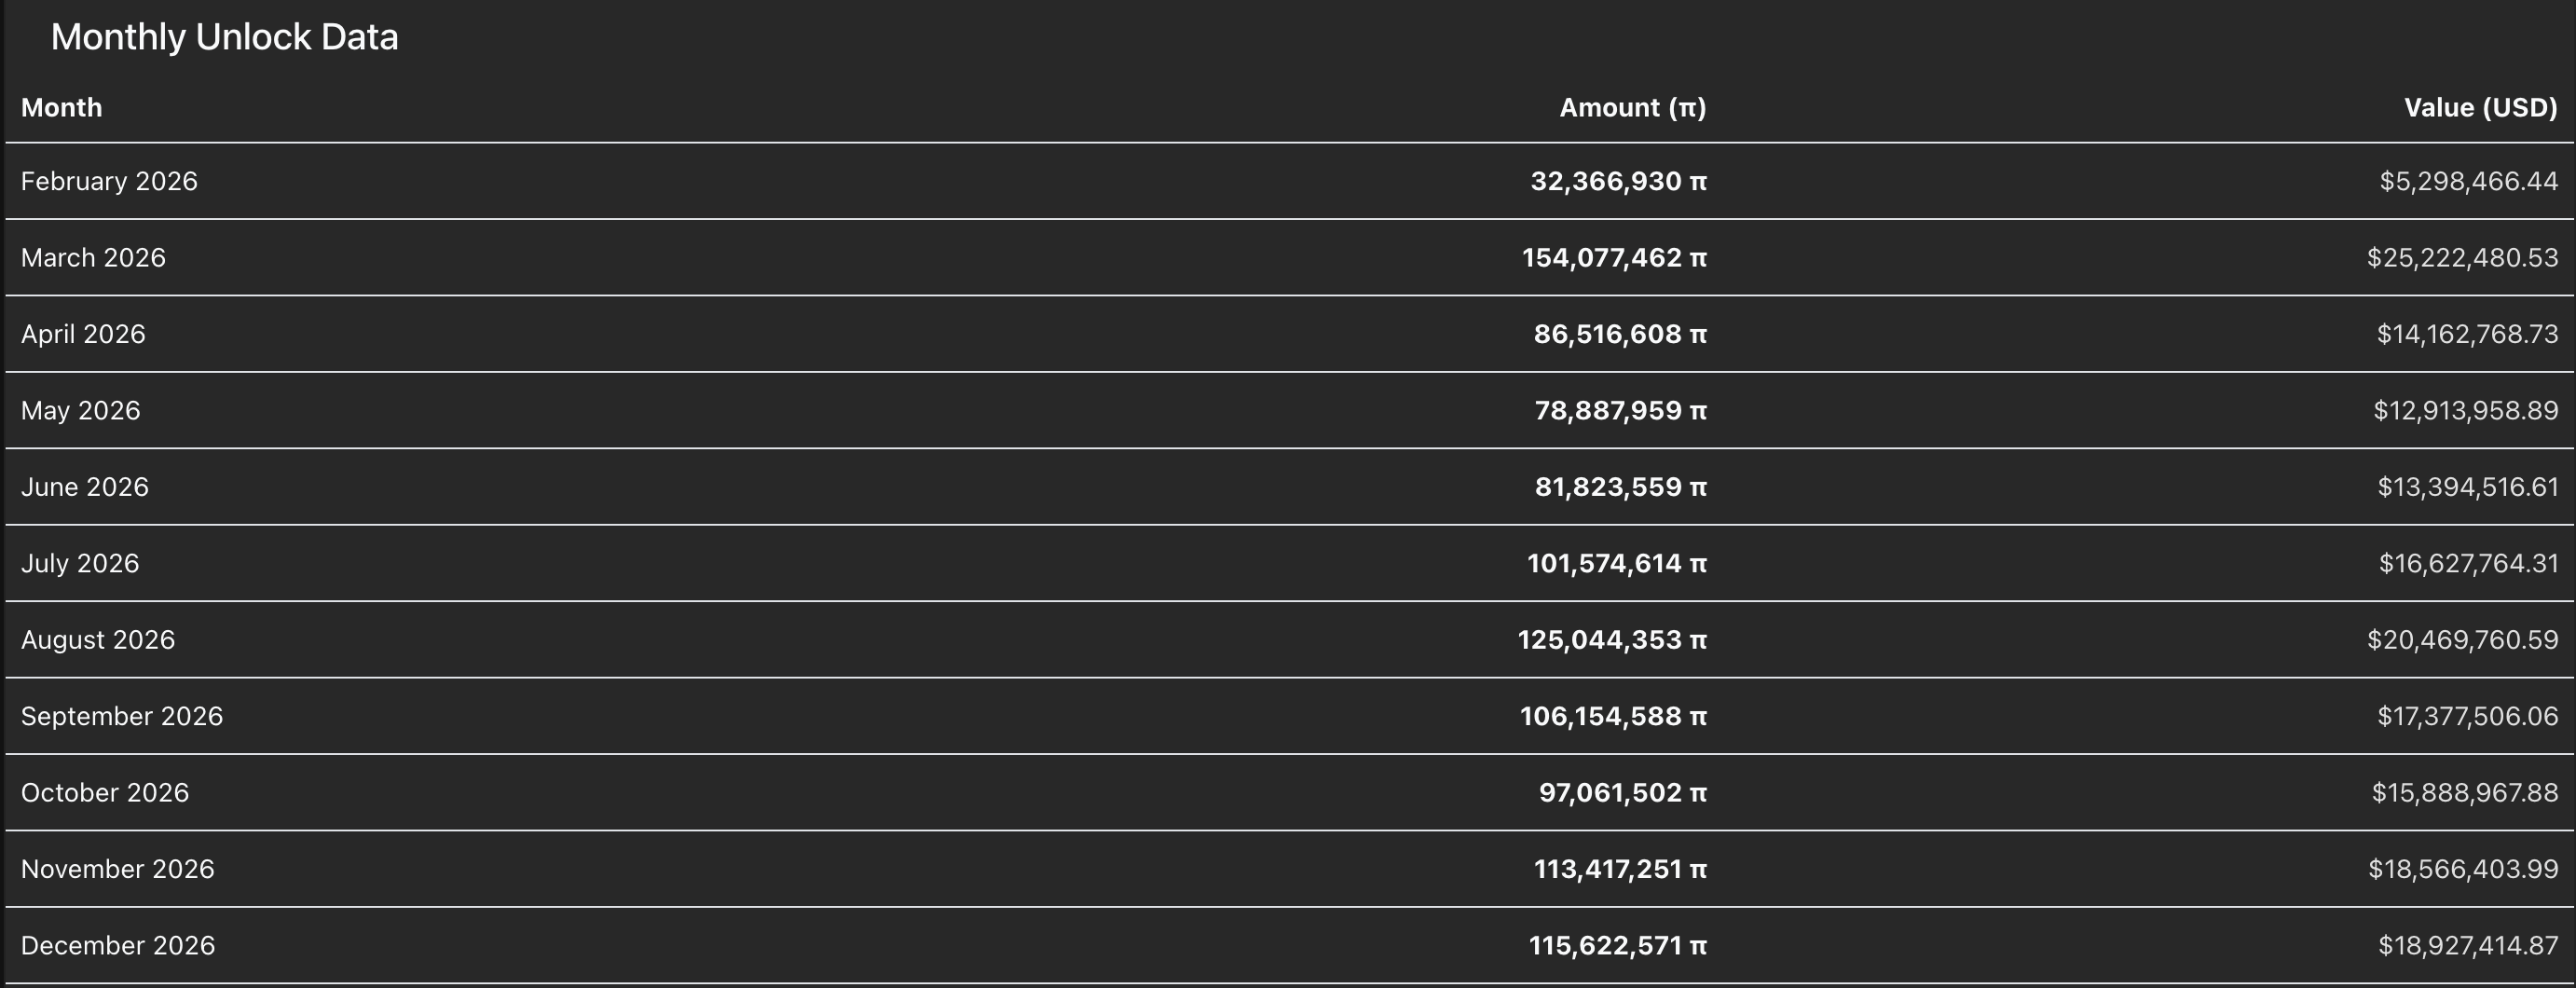
Meanwhile, the monthly token unlock data shows that 32.36 million PI tokens remain to be unlocked in February so far, followed by an additional 154.07 million PI tokens in March. This steady monthly unlock rate weighs on Pi network recovery efforts as it increases its supply.
Technical outlook: Will Pi Network bounce back from its support level?
Pi network is trading in the green, up nearly 1% at the time of writing on Wednesday, extending the nearly 2% gains from the previous day. The PI token stabilizes above the $0.1533 support level, marked by the October 10 low, after a reversal from the $0.1919 resistance level, resulting in a roughly 15% loss.
If Pi Network loses the $0.1538 support level, it could threaten the $0.1300 record low from February 6. The technical indicators on the daily chart maintain a bearish side bias.
The Relative Strength Index (RSI) at 47 flattens below the halfway line after falling from the February 17 high of 62, reflecting a significant reduction in buying pressure. At the same time, the Moving Average Convergence Divergence (MACD) flattens out slightly above the signal line as positive histograms contract, indicating a higher risk of a bearish crossover.
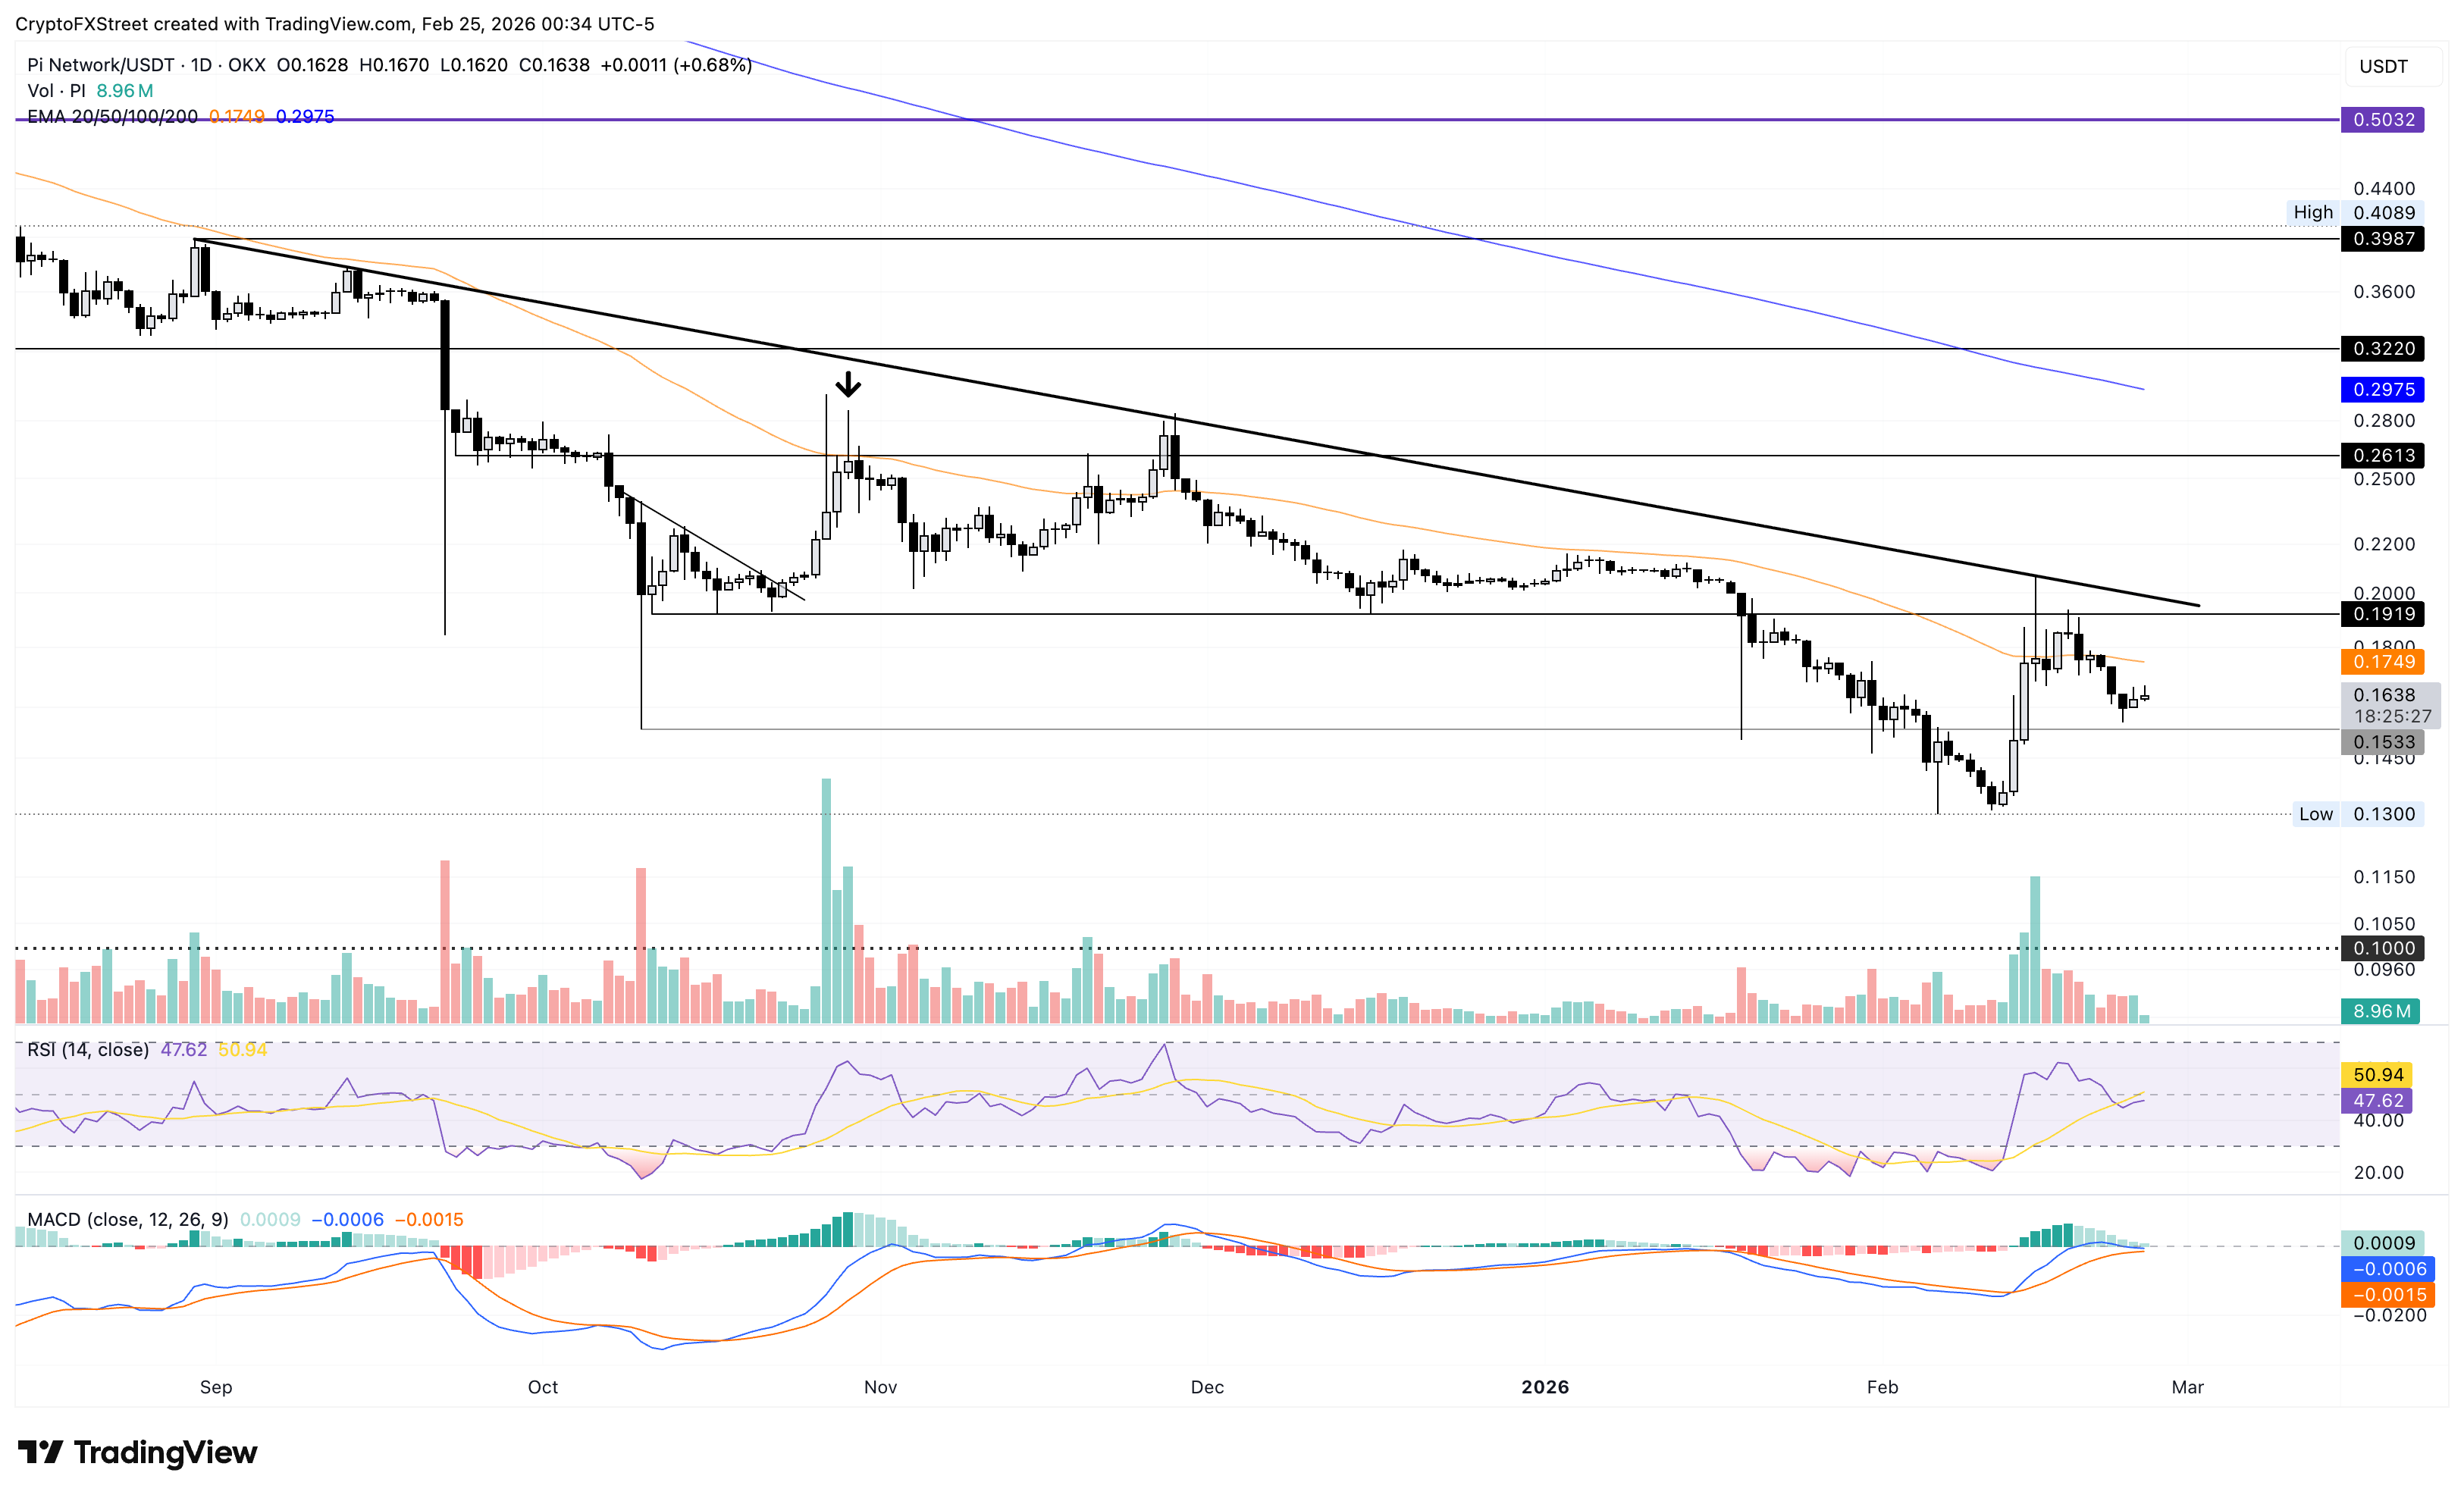
Looking up, any chances of a sustained recovery depend on PI clearing the 50-day Exponential Moving Average (EMA) at $0.1749. In this scenario, it could target the $0.1919 resistance level, placed near a descending trendline connecting the August 30 and February 15 highs.
A breakout above this level could open doors toward the $0.2613 level, which aligns with the September 23 low.

More than a million users rely on FXStreet for real-time market data, charting tools, expert insights, and forex news. Its comprehensive economic calendar and educational webinars help traders stay informed and make calculated decisions. FXStreet is supported by a team of about 60 professionals, split between the Barcelona headquarters and various global regions.
Read More


