


What is the MACD Oscillator?
The Moving Average Convergence Divergence (MACD) oscillator is one of the most popular and widely used technical analysis indicators for traders and analysts to gauge market momentum. Developed in the late 1970s, it has become a staple tool for technical analysts seeking to identify potential trend changes, momentum shifts, and trading opportunities.
MACD stands out among technical indicators because it combines elements of trend following and momentum oscillation, providing traders with a versatile tool that can offer insights into various market conditions. Unlike many other technical indicators that give only one type of signal, the MACD offers multiple ways to analyze price action.
Traders and analysts use a variety of technical indicators to spot market trends, anticipate potential shifts in trading, and ultimately, trade themselves successfully or offer advice to clients so that they may trade successfully. Among these indicators, the MACD has been popular for decades due to its effectiveness and relative simplicity.
History and Development of the MACD
Gerald Appel, a prominent technical analyst and publisher of the "Systems and Forecasts" financial newsletter, developed the Moving Average Convergence Divergence in the latter part of the 1970s. His goal was to create an indicator that could identify changes in the strength, direction, momentum, and duration of a trend in a stock's price.
Appel initially developed only the MACD line and signal line. It wasn't until later, in 1986, that Thomas Aspray enhanced the indicator by adding the histogram feature, which made the MACD even more visually informative and easier for traders to interpret.
Despite being over four decades old, the MACD has remained relevant in modern trading environments, from traditional stock markets to forex, commodities, and even cryptocurrency trading. Its endurance speaks to its utility and effectiveness across different market types and periods.
Core Components of the MACD
The MACD indicator consists of three essential components that work together to provide traders with valuable insights into market conditions:
The MACD Line

Figure 1: Explanation of the MACD Indicator
The MACD line is the core component of the indicator and represents the difference between two exponential moving averages (EMAs), typically the 12-period EMA and the 26-period EMA. This line fluctuates above and below the zero line (also called the centerline) as the moving averages converge, cross, and diverge.
When the shorter-term EMA (12-period) rises above the longer-term EMA (26-period), the MACD line moves above the zero line, indicating increasing bullish momentum. Conversely, when the shorter-term EMA falls below the longer-term EMA, the MACD line moves below the zero line, signaling to increase in bearish momentum.
The Signal Line
The signal line is a 9-period EMA of the MACD line itself. It is a trigger mechanism for buy and sell signals when the MACD line crosses above or below it. The signal line helps smooth out the MACD line's movements, making identifying potential entry and exit points easier.
When the MACD line crosses above the signal line, it generates a bullish signal, suggesting a potential buying opportunity. When it crosses below the signal line, it produces a bearish signal, indicating a potential selling opportunity.
The MACD Histogram
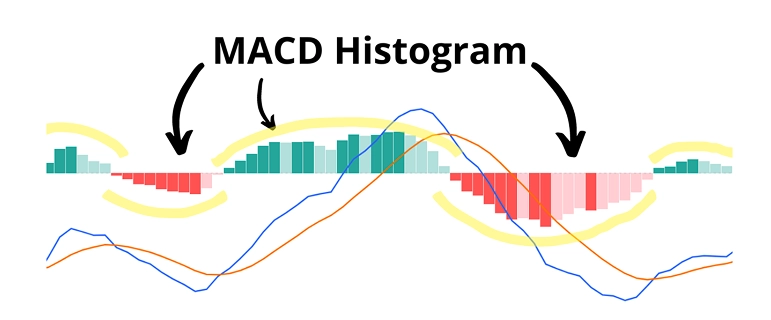
Figure 2: MACD Histogram
The MACD histogram visualizes the difference between the MACD line and the signal line. When the MACD line is above the signal line, the histogram is positive (displayed as bars above the zero line). The histogram is negative when the MACD line is below the signal line (displayed as bars below the zero line).
The height of the histogram bars represents the distance between the MACD line and the signal line. As this distance increases, the histogram bars grow taller, indicating strengthening momentum in the direction of the trend. Conversely, the histogram bars shrink as the distance decreases, suggesting weakening momentum.
How is MACD Calculated?
The MACD reflects the changing relationship of short-term exponential moving averages to long-term exponential moving averages. Understanding its calculation helps traders grasp how the indicator works and why it provides valuable signals.
The basic equation used to calculate the MACD is as follows:
Traders and analysts typically use closing prices for 12-day and 26-day periods to generate the EMAs used to calculate the Moving Average Convergence Divergence (MACD). Following this, a 9-day moving average for the MACD line itself is plotted alongside the indicator to serve as the signaling line that will help illuminate when a market may be turning.
Step-by-Step Calculation Example
To better understand how the MACD is calculated, let's walk through a simplified example:
Calculate the 12-day EMA of the asset's price For a stock trading at various prices over 12 days, you would calculate the 12-day EMA, giving more weight to recent prices.
Calculate the 26-day EMA of the asset's price Similarly, you would calculate the 26-day EMA, which responds more slowly to price changes than the 12-day EMA.
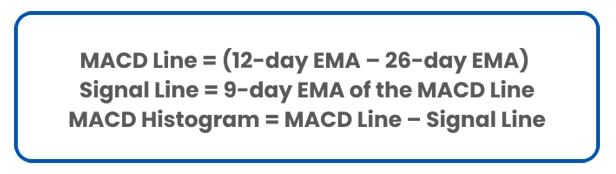
Calculate the MACD Line Subtract the 26-day EMA from the 12-day EMA. MACD Line = (12-day EMA – 26-day EMA)
Calculate the Signal Line Compute the 9-day EMA of the MACD Line calculated in step 3.
Calculate the MACD Histogram Subtract the Signal Line from the MACD Line. MACD Histogram = MACD Line – Signal Line

Figure 3: MACD Calculation Process
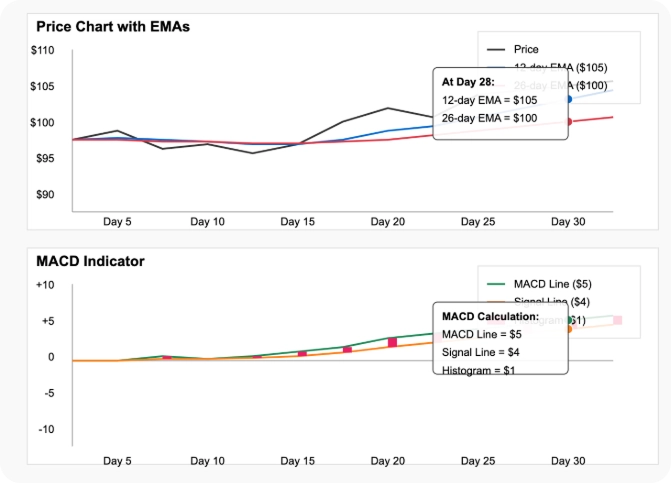
Figure 4: MACD Chart Visualisation
For example, if the 12-day EMA is $105 and the 26-day EMA is $100:
MACD Line = $105 - $100 = $5
If the 9-day EMA of the MACD Line (Signal Line) is $4
MACD Histogram = $5 - $4 = $1
Customizing MACD Parameters
While the standard parameters for MACD are 12, 26, and 9, traders can adjust these values to suit their specific trading strategies or timeframes:
Faster MACD: Using shorter periods (e.g., 5, 13, and 4) creates a more responsive indicator that generates more signals but may produce more false positives.
Slower MACD: Using longer periods (e.g., 19, 39, and 9) creates a more conservative indicator that generates fewer but potentially more reliable signals.
Experienced traders often experiment with different parameter settings to find the best combination for their trading style, specific assets, and preferred timeframes.
How to Interpret the MACD?
The MACD is built on movement – the movement of moving averages either towards one another (convergence) or away from one another (divergence). The Moving Average Convergence Divergence indicator fluctuates, or oscillates, over and under the zero line, otherwise known as the centerline. This fluctuation is a crossover that signals to traders that the shorter moving average has crossed the path of the longer one.
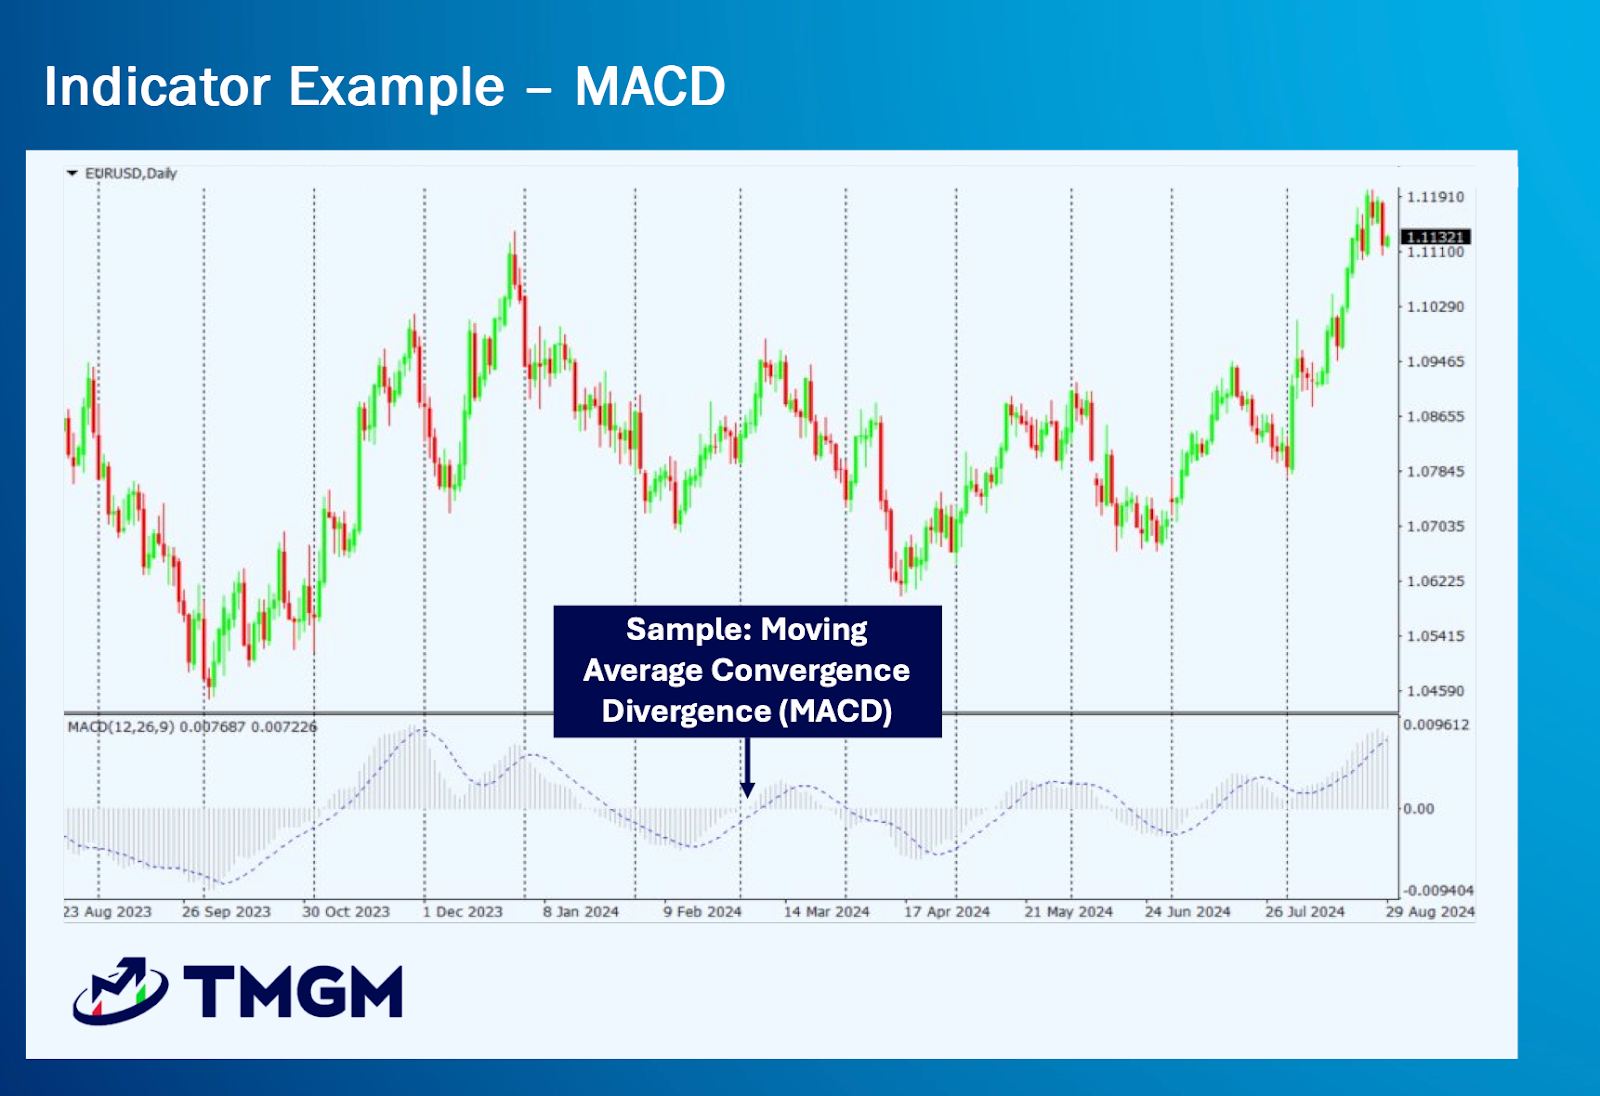
Figure 5: MACD Chart
Crossing the Zero Line
Zero line crossovers occur when the MACD line passes through the centerline (zero line), indicating changes in the trend direction:
Bullish Zero Line Crossover: When the MACD line moves from below to above the zero line, it signals that the 12-day EMA has crossed above the 26-day EMA, indicating a potential uptrend. This can be interpreted as a buying opportunity.
Bearish Zero Line Crossover: When the MACD line crosses from above to below the zero line, it indicates that the 12-day EMA has fallen below the 26-day EMA, suggesting a potential downtrend. This might be considered a selling opportunity.
Zero-line crossovers are often used to identify the overall trend direction. When the MACD is above zero, the general trend is considered bullish; below zero, the trend is considered bearish.
Crossing the Signal Line
Crossovers of the signal line by the Moving Average Convergence Divergence line are one of the indicator's staple signals. The signal line, as covered already, is the 9-day moving average of the MACD line itself. The signal line is an estimated valuation for the oscillator's movement that makes bullish and bearish MACD turns easier to see.
Bullish Signal Line Crossover: When the MACD line crosses above the signal line, it generates a bullish signal, suggesting a potential buying opportunity. This crossover indicates increasing upward momentum.
Bearish Signal Line Crossover: When the MACD line crosses below the signal line, it produces a bearish signal, indicating a potential selling opportunity. This crossover suggests increasing downward momentum.
Signal line crossovers often occur more frequently than zero line crossovers, providing more trading opportunities. However, they can also generate false signals, especially in choppy or sideways markets.
Moving Average Divergence
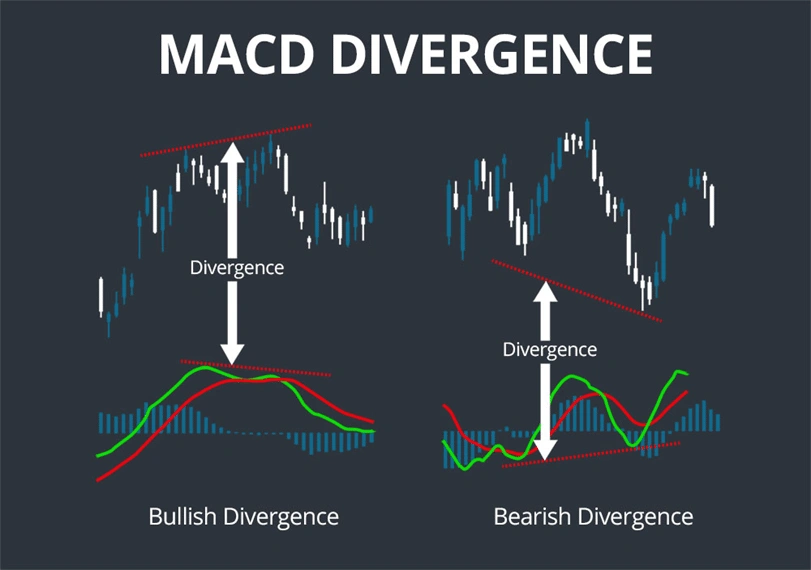
Figure 6: MACD Divergence
The MACD is frequently watched by analysts for signs of divergence from the movement of price. Divergence occurs when the price of an asset and the MACD indicator move in opposite directions, signaling potential trend reversals:
Bullish Divergence: When the price forms lower lows, but the MACD forms higher lows, it creates a bullish divergence. This suggests that downward momentum is weakening, potentially leading to a trend reversal to the upside.
Bearish Divergence: When the price creates higher highs, but the MACD forms lower highs, it makes a bearish divergence. This indicates that upward momentum is waning, possibly leading to a downward trend reversal.
Divergences are considered stronger signals when they occur after extended price moves and in extreme territory (when the MACD is significantly above or below the zero line).
Histogram Analysis
The MACD histogram provides additional insights into momentum changes:
Increasing Positive Histogram: When the histogram bars grow larger above the zero line, it indicates increasing bullish momentum.
Decreasing Positive Histogram: When the histogram bars shrink while still above the zero line, it suggests weakening bullish momentum, potentially foreshadowing a bearish crossover.
Increasing Negative Histogram: When the histogram bars grow larger below the zero line, it signals increasing bearish momentum.
Decreasing Negative Histogram: When the histogram bars shrink while still below the zero line, it indicates weakening bearish momentum, potentially preceding a bullish crossover.
Histogram analysis is particularly useful for identifying early changes in momentum before actual crossovers occur, allowing traders to prepare for potential trend changes.
Finding Entry and Exit Points with MACD
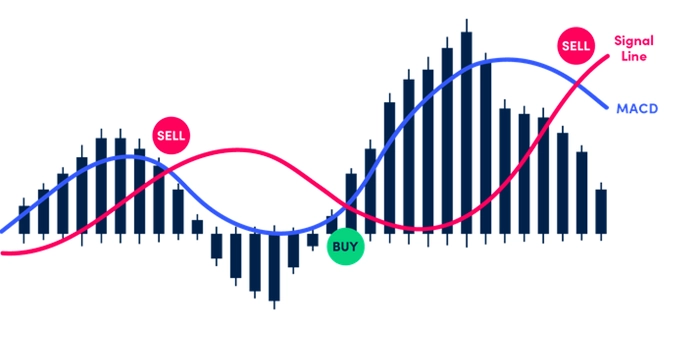 Figure 7: Entry and Exit Points
One of the most valuable applications of the MACD indicator is its ability to help traders identify potential entry and exit points for trades. Understanding how to interpret MACD signals for trade timing can significantly enhance trading results.
Entry Points Using MACD
The MACD provides several types of signals that can serve as potential entry points:
1. Signal Line Crossovers The most common MACD buy signal occurs when the MACD line crosses above the signal line:
Buy Signal: MACD line crosses above the signal line
Stronger Buy Signal: When this crossover happens below the zero line, it may indicate a reversal from a downtrend
2. Zero Line Crossovers When the MACD line crosses above the zero line, it indicates that the shorter-term EMA has crossed above the longer-term EMA:
Buy Signal: MACD line crosses above the zero line, suggesting a potential new uptrend
3. Bullish Divergence One of the most powerful MACD signals:
Buy Signal: When price makes a new low, but the MACD makes a higher low
This suggests bearish momentum is weakening even though prices are still falling
4. Histogram Reversals
Buy Signal: When the histogram starts growing from negative territory (becoming less negative)
This can provide an early indication before an actual MACD line/signal line crossover
Exit Points Using MACD
Similarly, the MACD can help identify optimal times to exit positions:
1. Signal Line Crossovers
Sell Signal: MACD line crosses below the signal line
Stronger Sell Signal: When this crossover happens above the zero line after an extended uptrend
2. Zero Line Crossovers
Sell Signal: The MACD line crosses below the zero line, suggesting a change from bullish to bearish momentum
3. Bearish Divergence
Sell Signal: When price makes a new high, but the MACD makes a lower high
This suggests bullish momentum is weakening despite rising prices
4. Overextended MACD
Sell Signal: When the MACD line stretches too far above the signal line
This often indicates an overbought condition where a correction is likely
Practical MACD Trading Tips
Avoid False Signals: Confirm MACD signals with other indicators or price action before entering trades.
Consider the Trend: MACD signals work best when trading toward the overall trend.
Timeframe Matters: MACD signals on higher timeframes (daily, weekly) are typically more reliable than on lower timeframes (1-minute, 5-minute).
Signal Strength: The stronger the crossover (wider distance between MACD and signal line), the stronger the potential move.
Look for Confluence: The most powerful trading opportunities occur when multiple MACD signals align simultaneously.
Mind the Context: A signal line crossover has different implications depending on where it occurs relative to the zero line.
Example MACD Entry and Exit Strategy
Here's a simple MACD trading strategy many traders use:
Entry (Buy):
Wait for the MACD line to cross above the signal line
Confirm that the histogram is increasing in size
Ensure the crossover aligns with the overall trend
Look for supporting price action (like a bounce-off support)
Exit (Sell):
When the MACD line crosses below the signal line
When a bearish divergence forms after an extended uptrend
When profit targets based on other technical analysis are reached
When your predetermined stop-loss is hit
Remember that while MACD is powerful, no indicator is perfect. Always use proper risk management, regardless of how strong a MACD signal appears.
MACD Trading Strategies
The versatility of the MACD makes it suitable for various trading strategies. Here are some of the most common and effective MACD-based trading approaches:
MACD Crossover Strategy
The MACD crossover strategy is perhaps the most widely used MACD trading approach:
Entry Rules:
For long positions: Enter when the MACD line crosses above the signal line while both lines are below the zero line.
For short positions: Enter when the MACD line crosses below the signal line while both lines are above the zero line.
Exit Rules:
For long positions: Exit when the MACD line crosses below the signal line.
For short positions: Exit when the MACD line crosses above the signal line.
This strategy works best in trending markets and can be enhanced by considering the overall market trend and using additional confirmation indicators.
Zero Line Crossover Strategy
The zero-line crossover strategy focuses on major trend changes:
Entry Rules:
For long positions: Enter when the MACD line crosses above the zero line.
For short positions: Enter when the MACD line crosses below the zero line.
Exit Rules:
For long positions: Exit when the MACD line crosses below the zero line.
For short positions: Exit when the MACD line crosses above the zero line.
This strategy typically generates fewer signals than the MACD crossover strategy but may identify more significant trend changes.
Divergence Trading Strategy
The divergence trading strategy looks for discrepancies between price action and MACD readings:
Entry Rules:
For long positions: Enter when a bullish divergence forms (price making lower lows while MACD makes higher lows).
For short positions: Enter when a bearish divergence forms (price making higher highs while MACD makes lower highs).
Exit Rules:
For long positions: Exit when the price reaches a previous resistance level or when a bearish divergence forms.
For short positions: Exit when the price reaches a previous support level or when a bullish divergence forms.
Divergence strategies often provide earlier signals for potential trend reversals but may require more experience to identify and interpret correctly.
Limitations of the MACD
While the MACD is a versatile and popular indicator, it's important to understand its limitations:
Lagging Indicator: As a moving average-based indicator, the MACD inherently lags behind price action. When a signal appears, a significant portion of the move may have already occurred.
False Signals: The MACD can generate numerous false signals, especially in choppy or sideways markets, that lead to unsuccessful trades.
No Consideration for Volatility: Unlike indicators such as Bollinger Bands or Average True Range, the MACD doesn't account for market volatility, which can affect the reliability of its signals.
Standardized Settings: The standard 12, 26, and 9 settings may not be optimal for all securities or timeframes. Customization may be necessary but requires experience and testing.
No Support/Resistance Identification: The MACD doesn't identify specific price levels of support or resistance, which are crucial for setting stop-loss orders and profit targets.
Awareness of these limitations allows traders to use the MACD more effectively, often by combining it with complementary indicators or adjusting their trading strategies accordingly.
The Bottom Line
The MACD is a versatile technical indicator that combines trend-following and momentum elements, making it valuable in various market conditions. Its ability to identify trend changes, momentum shifts, and potential reversal points has maintained its popularity among traders for decades.
Any time the signal line is crossed over at either extremely high or extremely low points, be cautious before you act. Similarly, if a crossover seems shallow, or seems to move either up or down but then plateaus, be vigilant but don't make a move in haste. The volatility in an underlying security can be deceptive and cause the MACD to move in unusual ways.
For best results, consider the following practices when using the MACD:
Use Multiple Timeframes: Analyze the MACD on higher timeframes to determine the overall trend, and then use lower timeframes for entry signals.
Combine with Other Indicators: Use the MACD with complementary indicators to confirm signals and filter out false positives.
Consider Market Context: Interpret MACD signals differently based on whether the market is trending, ranging, or experiencing high volatility.
Practice Patience: Wait for clear, strong signals rather than trying to trade every MACD crossover.
Implement Proper Risk Management: Always use appropriate stop-loss orders and position sizing regardless of how strong a MACD signal appears.
As with anything, practicing the MACD and working with it regularly will allow you to get a feel for its common patterns and movements and help you sharpen your eye when it comes to extreme or uncommon fluctuations. The longer you work with this versatile indicator, the more effective it will become in your trading strategy.
Start Trading with MACD at TMGM
Ready to apply MACD analysis to your trading strategy? TMGM offers advanced charting tools with MACD indicators, enabling traders to effectively incorporate this technical analysis method.
Why Choose TMGM for Your Trading Needs:
Advanced Charting Platforms – Access professional-grade charting with customizable MACD settings and multi-timeframe analysis.
Educational Resources – Learn to trade MACD with comprehensive guides, webinars, and expert insights.
Efficient Order Execution – Execute trades with competitive processing speeds.
Competitive Spreads – Trade with low spreads on various instruments.
Trading Support – Get assistance from our market analysts.
Risk-Free Practice – Test MACD strategies with virtual funds on a free demo account.
Join thousands of successful traders who rely on TMGM's powerful technical analysis tools and expert guidance. Experience the TMGM difference in your MACD trading journey.