
GBP/JPY Price Forecast: Pound is looking for direction around 213.00
By Guillermo Alcala
Date Published: 20 Jan 2026 | Date Modified: 20 Jan 2026


POPULAR ARTICLES

The Pound pulled back from session highs at the 213.50 area against the Japanese Yen on Tuesday, following mixed UK employment figures. Still, downside attempts remain contained above 212.30, leaving the pair in no man’s land.
- GBP/JPY rebound from 210.30 has been capped at 213.40.
- The Pound lost steam following mixed UK employment figures.
- The Japanese Yen remains under pressure following PM Takaichi's decision to call elections.
The Pound pulled back from session highs at the 213.50 area against the Japanese Yen on Tuesday, following mixed UK employment figures. Still, downside attempts remain contained above 212.30, leaving the pair in no man’s land.
Net employment increased by 82K in the UK in the three months to December, following a 17K contraction in November. Wage growth remained at strong levels while claimants for unemployment benefits grew less than expected. On the negative side, the jobless rate remained steady at 5.1% against market expectations of a slight decline to 5%.
The pair, however, remains supported by Yen weakness, amid growing fiscal concerns following Prime Minister Sanae Takaichi’s decision to call snap elections as well as her plans to suspend the 8% food tax for two years.
Technical Analysis: Potential Head and Shoulders formation in progress
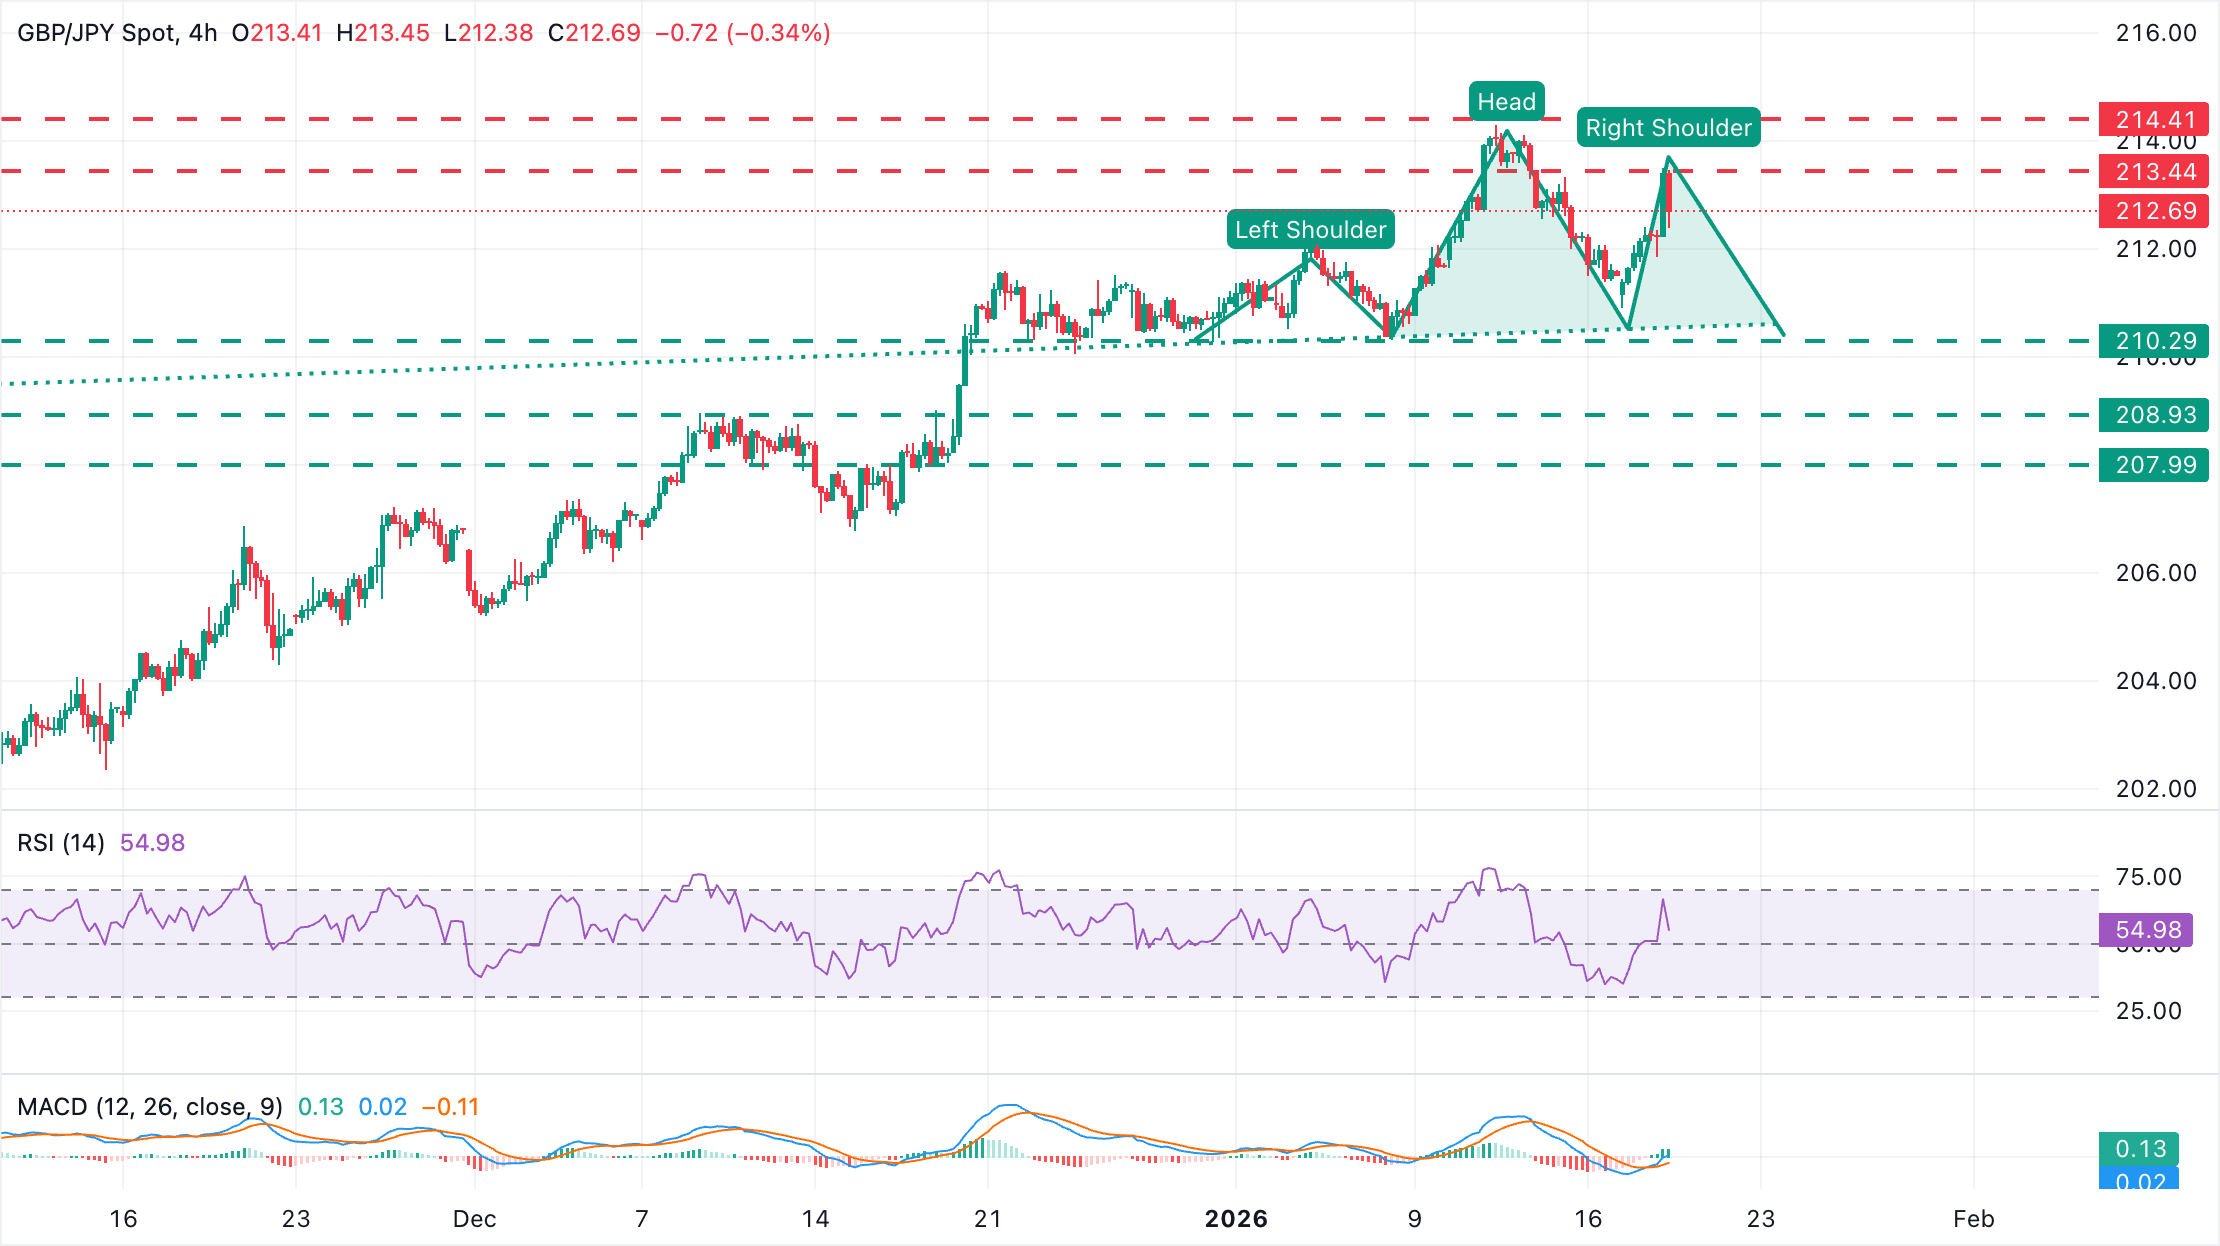
GBP/JPY trades at 212.75. The Bullish engulfing candle printed in the daily chat on Monday suggests a strong support in the 210.30 area, but the pair's rejection at 213.50 might print the right shoulder of a H&S formation, a bearish sign.
Technical indicators are positive. The 4-Hour Moving Average Convergence Divergence (MACD) line stands above the Signal line and slightly above zero, with a widening positive histogram that suggests strengthening bullish momentum. The Relative Strength Index (RSI) remains above 50, but is pulling down from higher levels.
Bulls would have to breach session highs at 213.40 to clear the path towards the long-term highs at 214.30. On the downside, key support is at the 210.30 area, the late December and early January lows, and the neckline of the mentioned H&S. Further down, the December 10 lows, near 208.90 w
(The technical analysis of this story was written with the help of an AI tool.)
Japanese Yen Price Today
The table below shows the percentage change of Japanese Yen (JPY) against listed major currencies today. Japanese Yen was the strongest against the US Dollar.
| USD | EUR | GBP | JPY | CAD | AUD | NZD | CHF | |
|---|---|---|---|---|---|---|---|---|
| USD | -0.68% | -0.26% | -0.14% | -0.30% | -0.24% | -0.68% | -0.93% | |
| EUR | 0.68% | 0.41% | 0.54% | 0.38% | 0.45% | -0.01% | -0.26% | |
| GBP | 0.26% | -0.41% | 0.13% | -0.03% | 0.03% | -0.41% | -0.67% | |
| JPY | 0.14% | -0.54% | -0.13% | -0.14% | -0.09% | -0.54% | -0.78% | |
| CAD | 0.30% | -0.38% | 0.03% | 0.14% | 0.06% | -0.39% | -0.63% | |
| AUD | 0.24% | -0.45% | -0.03% | 0.09% | -0.06% | -0.44% | -0.68% | |
| NZD | 0.68% | 0.00% | 0.41% | 0.54% | 0.39% | 0.44% | -0.26% | |
| CHF | 0.93% | 0.26% | 0.67% | 0.78% | 0.63% | 0.68% | 0.26% |
The heat map shows percentage changes of major currencies against each other. The base currency is picked from the left column, while the quote currency is picked from the top row. For example, if you pick the Japanese Yen from the left column and move along the horizontal line to the US Dollar, the percentage change displayed in the box will represent JPY (base)/USD (quote).

Acuity Trading is a London-based fintech company founded in 2013 that specializes in AI-powered alternative data and sentiment analysis for trading and investments. They revolutionized the online trading experience by introducing visual news and sentiment tools, and today they continue to lead the fintech market with alpha-generating alternative data and highly engaging trading tools using the latest AI research and technology.
Read More


