
The Power of Entrance Indicators
Entrance indicators help traders identify potential trading opportunities. Let's dive into the top three indicators that can give you an edge in spotting profitable entry points.
Moving Average Convergence Divergence (MACD)
The MACD is a versatile trend-following momentum indicator that shows the relationship between two moving averages of a price.
How it works:
The MACD line is calculated by subtracting the 26-period Exponential Moving Average (EMA) from the 12-period EMA.
The signal line is a 9-period EMA of the MACD line.
A histogram displays the difference between the MACD and signal lines.
Trading signals:
Buy signal: When the MACD line crosses above the signal line
Sell signal: When the MACD line crosses below the signal line
Strength confirmation: Look at the histogram - larger bars indicate stronger momentum
Real-world example: Imagine you're watching the EUR/USD pair. The MACD line crosses above the signal line, and you see the histogram bars growing. This could indicate a strong upward momentum, suggesting a potential buy opportunity.
TMGM Tip: On MetaTrader 4, you can customize MACD settings. Adjust the periods (12, 26, 9) to find the best fit for your trading style and the currency pair you're trading.
Relative Strength Index (RSI)
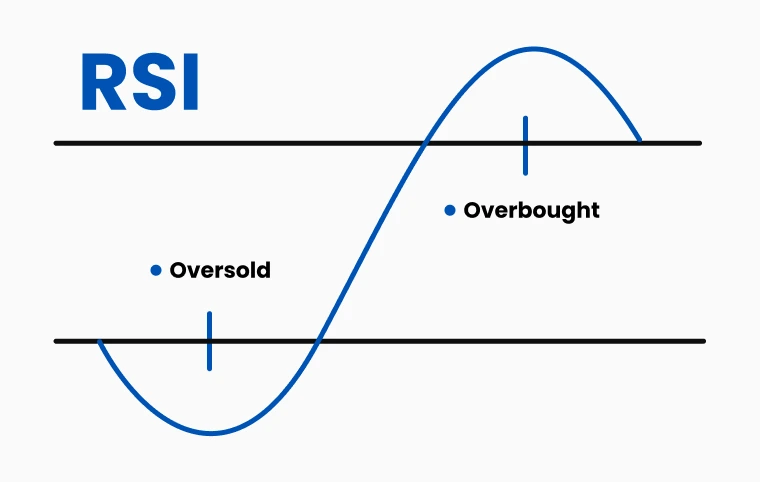
The RSI is a momentum oscillator that measures the speed and change of price movements, helping traders identify overbought or oversold conditions.
How it works:
RSI values range from 0 to 100.
Traditional settings consider above 70 as overbought and below 30 as oversold.
The indicator compares the magnitude of recent gains to recent losses.
Trading signals:
Buy signal: When RSI crosses above 30, indicating a potential upward reversal
Sell signal: When RSI crosses below 70, suggesting a potential downward reversal
Trend confirmation: RSI staying above 50 in uptrends or below 50 in downtrends
Real-world example: You're analyzing the GBP/JPY pair, and you notice the RSI has been hovering around 25 for a few days. Suddenly, it starts to climb and crosses above 30. This could indicate that the pair is oversold and might be due for an upward correction, presenting a potential buy opportunity.
TMGM Feature: TMGM's platform allows you to set custom alerts for when RSI crosses specific levels, helping you catch potential entry points even when you're not actively watching the charts.
Bollinger Bands
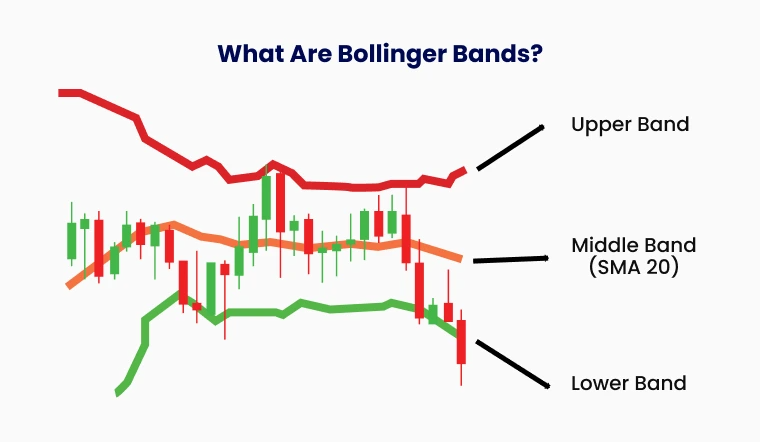
Bollinger Bands consist of a middle band (typically a 20-period Simple Moving Average) with two outer bands that expand and contract based on market volatility.
How it works:
The upper band is typically 2 standard deviations above the middle band.
The lower band is typically 2 standard deviations below the middle band.
The bands widen during volatile periods and contract during calmer periods.
Trading signals:
Buy signal: When the price touches or breaks below the lower band and starts to move back inside
Sell signal: When the price touches or breaks above the upper band and starts to move back inside
Volatility squeeze: When the bands contract, it often precedes a significant price move
Real-world example: You're watching the USD/CAD pair, and you notice the price has been hugging the lower Bollinger Band for several candles. Suddenly, a new candle forms that closes well inside the lower band. This could indicate a potential upward move, signaling a buying opportunity.
TMGM Tool: Use our advanced charting features to overlay Bollinger Bands on any forex pair. You can also adjust the number of standard deviations to make the bands more or less sensitive to price movements.
Mastering Exit Indicators
While entering a trade at the right time is crucial, knowing when to exit can be even more important for protecting your profits and minimizing losses. Explore the top three exit indicators to help you time your exits more effectively.
Parabolic SAR (Stop and Reverse)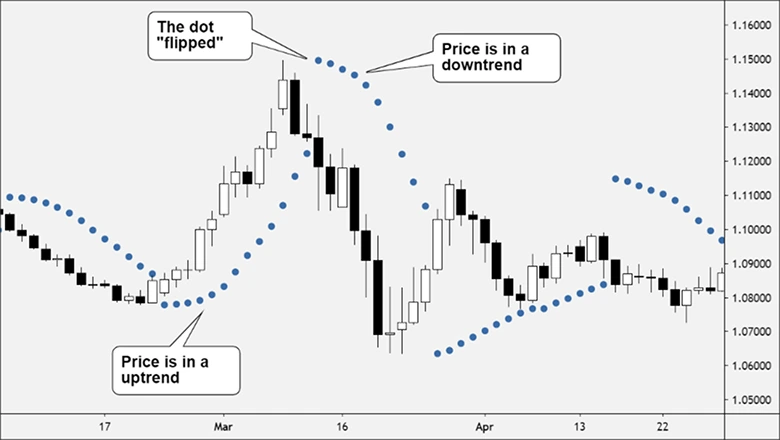
The Parabolic SAR (Stop and Reverse) indicator places dots on a chart indicating potential price movement reversals. It's particularly useful for setting trailing stops.
How it works:
Dots are placed above or below the price, depending on the trend.
In an uptrend, the dots appear below the price; in a downtrend, they appear above.
The indicator "flips" when a potential trend reversal occurs.
Exit signals:
Exit long trade: When the dots move above the price
Exit short trade: When the dots move below the price
Real-world example: You're in a long position on AUD/USD, and the Parabolic SAR dots have been consistently below the price. Suddenly, a new dot appears above the price. This could indicate that the uptrend is losing steam, signaling it might be time to exit your long position.
TMGM Application: On MetaTrader 4, you can easily add the Parabolic SAR to your charts. Experiment with the step and maximum step settings to adjust the indicator's sensitivity to price movements.
Moving Averages
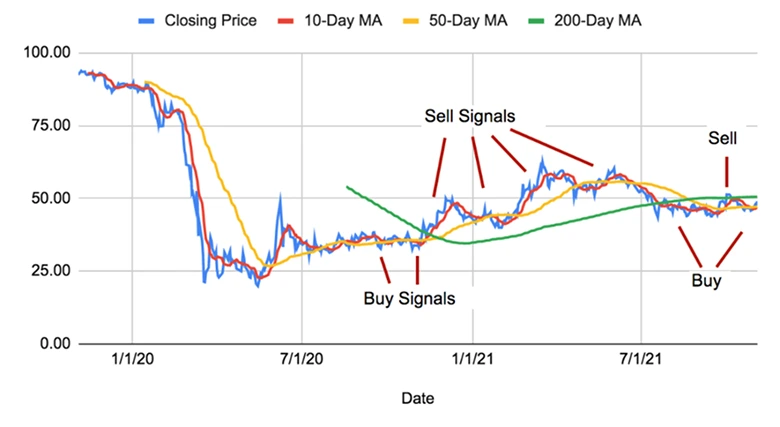
Moving averages smooth out price data to create a single flowing line, helping traders identify trends and potential reversal points.
How it works:
Simple Moving Average (SMA): Calculates the average price over specific periods.
Exponential Moving Average (EMA): This index weights recent prices more, making it more responsive to new information.
Exit signals:
Exit long trade: When the price crosses below the moving average
Exit short trade: When the price crosses above the moving average
Additional confirmation: When a shorter-term MA crosses below a longer-term MA (for long trades) or above (for short trades)
Real-world example: You're in a short position on EUR/GBP, using a 50-day EMA. The price has been consistently below the EMA, but you notice it's starting to approach the line. When the price closes above the EMA, it might be time to consider exiting your short position.
TMGM Advantage: TMGM's platforms offer multiple types of moving averages (Simple, Exponential, Weighted). Try combining different types and periods for more robust exit signals.
Stochastic Oscillator
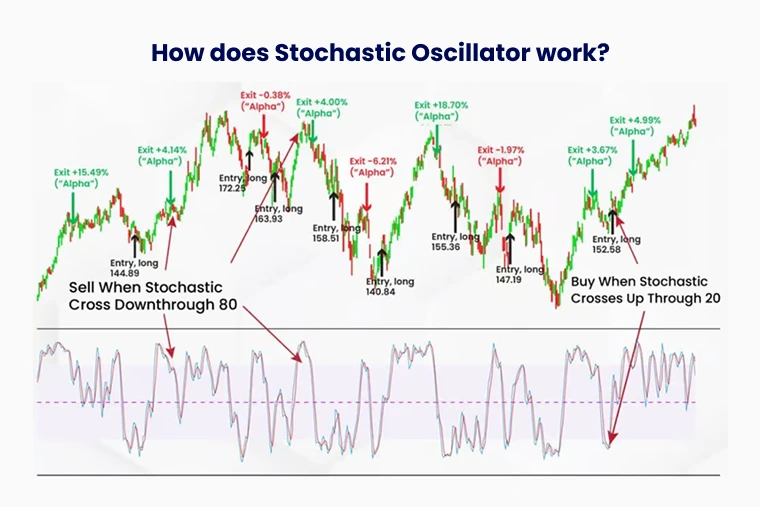
The Stochastic Oscillator is a momentum indicator that compares a closing price to its price range over a specific period. It's particularly useful for identifying potential reversal points.
How it works:
The indicator has two lines: %K (the main line) and %D (the signal line).
Values range from 0 to 100.
Traditional settings consider above 80 as overbought and below 20 as oversold.
Exit signals:
Exit long trade: When Stochastic crosses below 80 from above
Exit short trade: When Stochastic crosses above 20 from below
Divergence: When the indicator trend doesn't match the price trend, signaling a potential reversal
Real-world example: You're in a long position on USD/JPY, and the Stochastic has been above 80 for several days, indicating overbought conditions. When you see the %K line cross below the %D line while still above 80, it might be a good time to consider taking profits on your long position.
TMGM Feature: Our customizable alerts notify you when the Stochastic Oscillator crosses key levels, helping you catch exit points even when you're away from your trading screen.
How to Choose the Best Indicator for Entry and Exit
Selecting the best forex indicators for entry and exit depends on your trading goals, style, and the market conditions you are navigating. Entry indicators, such as the Moving Average Convergence Divergence (MACD) or the Relative Strength Index (RSI), are ideal for spotting opportunities to open trades. The MACD helps identify trend strength and momentum by comparing moving averages, while the RSI detects overbought or oversold conditions, signaling potential reversals. These indicators are particularly effective for determining when market conditions are favourable for entering a position.
For exits, indicators like the Parabolic SAR or Moving Averages provide clear guidance on when to close trades. The Parabolic SAR places dots on the chart to signal trend reversals, making it useful for setting trailing stops. Meanwhile, Moving Averages smooth out price fluctuations to highlight when the market might be losing momentum, suggesting it’s time to lock in profits or cut losses.
The most effective approach often involves combining entry and exit indicators. For instance, you could use the MACD to identify an entry point when the market trend is strong and confirm it with the RSI showing an oversold condition. For exits, the Parabolic SAR could signal a reversal, which you might further validate with a Moving Average crossover. This complementary use of indicators ensures that your trading decisions are well-informed and balanced, increasing the likelihood of success while managing risk effectively.
Combining Entrance and Exit Indicators for Powerful Results
While individual indicators can be useful, combining entrance and exit indicators often leads to more robust trading strategies. Here's an example of how you might combine indicators for both entering and exiting trades:
MACD and Parabolic SAR Strategy:
Entrance:
Look for the MACD line to cross above the signal line (for a buy signal)
Confirm with RSI below 50 and rising
Exit:
Watch for the Parabolic SAR dots to flip from below the price to above
Confirm with Stochastic Oscillator crossing below 80 from above
Real-world example: You're analyzing the GBP/USD pair. The MACD line crosses above the signal line, and you notice the RSI is at 45 and rising. You enter a long position. You watch the Parabolic SAR dots below the price as the trade progresses. When a dot finally appears above the price, and you see the Stochastic Oscillator cross below 80, you decide to exit the trade, locking your profits.
TMGM Tip: Use our multi-screen setup to monitor multiple indicators simultaneously. You can have one screen for your entrance indicators and another for your exit indicators, making it easier to track both aspects of your trade.
Risk Management: The Key to Long-Term Success
While indicators can provide valuable insights, they're not infallible. Proper risk management is crucial for long-term trading success. Here are some key principles to keep in mind:
Set stop-losses: Always use stop-loss orders to limit potential losses. Consider using the Average True Range (ATR) indicator to set dynamic stop-losses based on market volatility.
Take profits: Don't get greedy. Set realistic profit targets using techniques like Fibonacci extension levels or key resistance/support levels.
Position sizing: Never risk more than 1-2% of your account on a single trade. Adjust your position size based on the distance to your stop-loss.
Diversification: Don't put all your eggs in one basket. Trade multiple currency pairs to spread your risk.
TMGM Tool: Our platforms offer easy-to-use features for setting stop-loss and take-profit levels. Using our position size calculator, you can determine the appropriate lot size based on your risk parameters.
Perfecting Your Strategy: Practice Makes Perfect
To get the most out of these indicators and develop a winning trading strategy:
Backtest: Use TMGM's Strategy Tester in MetaTrader 4 to see how your chosen indicators would have performed on historical data.
Keep a trading journal: Record which indicators work best for you in different market conditions. Note your entries, exits, and the reasoning behind each trade.
Stay educated: Use TMGM's webinars, tutorials, and market analysis to refine your understanding of forex markets and indicators continually.
Start with a demo account: Practice your strategy risk-free with a TMGM demo account before moving to live trading.
The best forex entrance and exit indicators can significantly improve your trading decisions, helping you identify profitable opportunities and protect your gains. However, remember that they're tools, not guarantees. Successful trading comes from a combination of solid technical analysis, strong risk management, and continuous learning.
By mastering these indicators and applying them wisely on TMGM's advanced trading platforms, you'll be well-equipped to navigate the exciting world of forex trading. Remember, the key to success lies in knowing the indicators and understanding how to interpret and apply them in real-world trading scenarios.
Ready to put these indicators to work? Open an account with TMGM today and access our state-of-the-art trading platforms, complete with all the indicators and tools you need for successful forex trading!


