
What is Heikin Ashi?
This term, derived from Japanese, means average bar. This indicator modifies how price values are displayed on a chart. To understand the Heikin Ashi formula a bit better, we have to understand the basics of Japanese candlesticks— a price chart showing opening, closing, high, and low price points for each period.
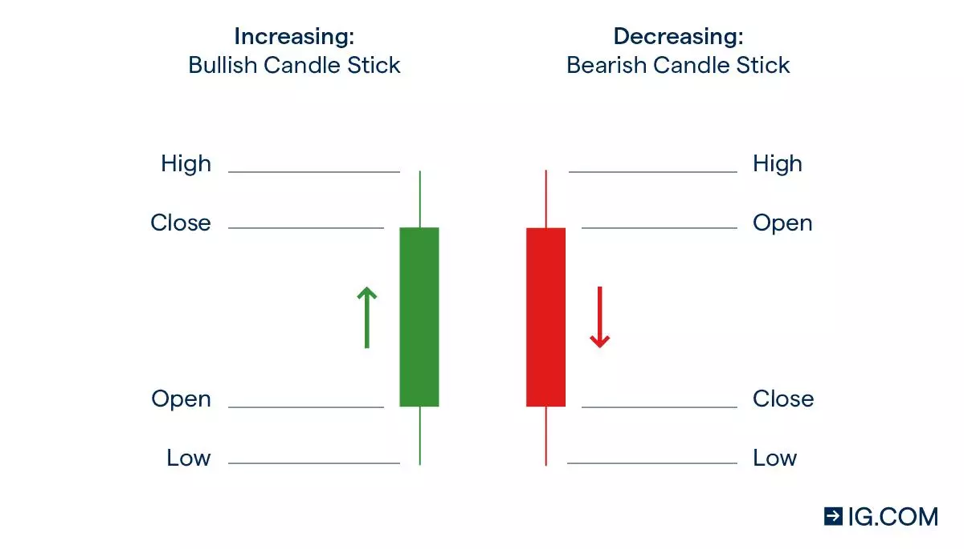
The candlestick’s upper wick or shadow represents the high, whereas the lower wick or shadow represents the low. The body of the candlestick represents the open and close. If you want patterns that can flag potential reversals, see reversal candlestick patterns.
Each candle reveals whether the price finishes the period lower or higher than when it began. If the close is lower than the opening, it signals downward pressure on the price. Hollow candlesticks suggest a bullish trend. The close being higher than the opening suggests upward pressure on the price.
However, in volatile markets, alternating bullish and bearish candles as the price oscillates can make it challenging to identify the trend. This is where the Heikin Ashi comes in handy. It modifies candlesticks to see trends using the average open, closed, highs and lows values. For trend-confirmation companions, consider RSI and MACD.
How do I use the Heikin Ashi strategy?
Traders get to set the time frame. If you want an hourly or daily time frame, set those options to obtain that period’s open, close, high and low. To keep trend context clear, pair Heikin Ashi with trend lines or momentum tools like RSI.
Trends and patterns
A smoothing technique is utilized to make trends easier to spot. Prices can fluctuate regardless of present or missing trends. These mixed signals can confuse traders.
Averaging helps smooth out short-term price variations. Here’s an illustration of a chart with and without Heikin Ashi Candlesticks:
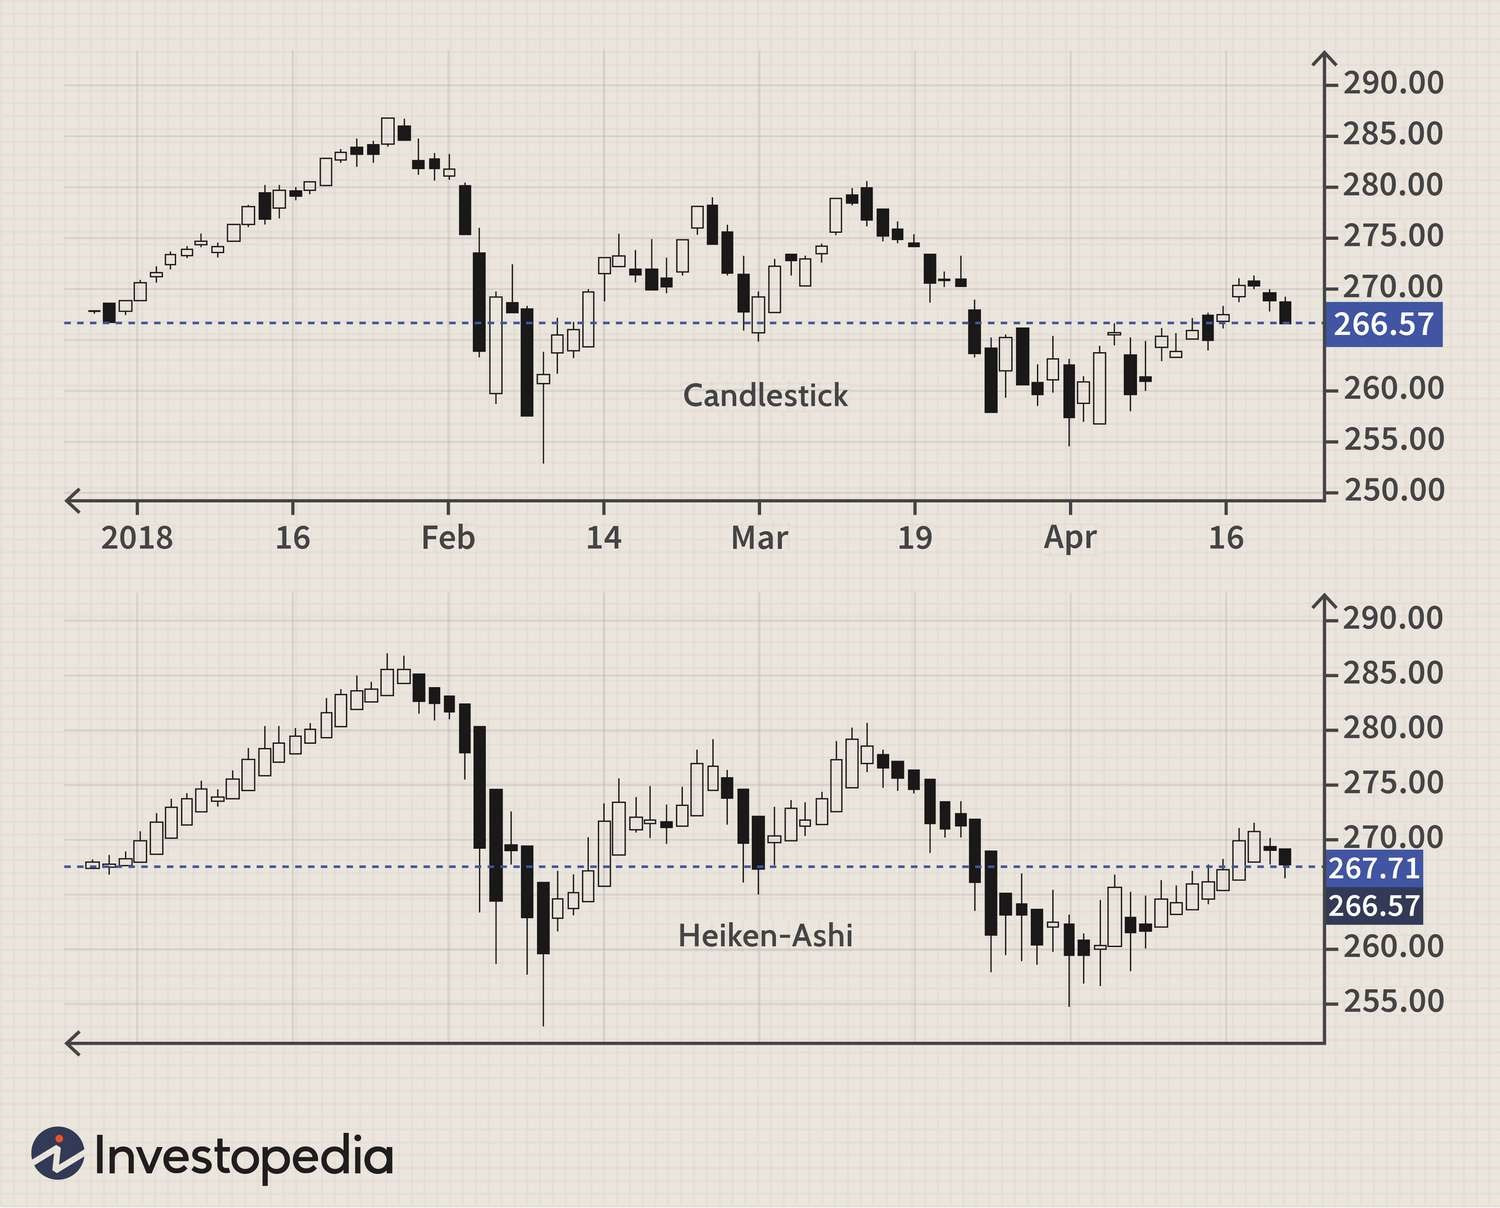
The Heikin Ashi looks smoother because it takes the average price movement. It also provides more consistent indicators of bullishness and bearishness. Heikin Ashi candlesticks tend to stay red during downtrends and green during uptrends; this differs from regular candlesticks, where colors alternate even if the price moves dominantly in one direction.


