
Direct answer: A Simple Moving Average, or SMA, is a technical indicator that calculates the average closing price of an asset over a selected number of periods. Traders use the SMA to smooth price data, identify trend direction, and track dynamic support or resistance on a chart.
What Is a Simple Moving Average (SMA)?
A Simple Moving Average is the average closing price of an asset over a fixed number of periods. A 20 period SMA, for example, adds the last 20 closing prices and divides the total by 20.
The SMA is part of the Moving Average (MA) family. It is the simplest version because every closing price in the selected period has the same weight.
Traders use the SMA to smoothen price fluctuations, reducing informational noise on the chart to read the trend of price direction more clearly.
Core Characteristics of the SMA
The SMA has three core traits. The SMA uses equal weighting, acts as a lagging indicator, and smooths short term price movement.
Smoothens Price
The SMA smooths price by averaging several closes into one line. That process removes part of the short term noise on the chart.
Equal Weighting
Equal weighting means each closing price affects the average by the same amount. The newest close and the oldest close inside the selected period carry identical importance.
Lagging Indicator
The SMA is a lagging indicator because the calculation uses past prices. The line reacts after the price has already moved.
How does Simple Moving Average (SMA) in trading work?
Add the closing prices for the selected period, then divide the total by the number of periods.
SMA Formula
In this formula, P represents each closing price and n represents the number of periods. A 20 period SMA uses the last 20 closing prices.
Step-by-Step Example Calculation
Assume a 5 period SMA uses these closing prices:
Step 1: Add the five closing prices.
10 + 11 + 12 + 11 + 14 = 58
Step 2: Divide the total by 5.
58 / 5 = 11.6
The 5 period SMA is 11.6
If the next closing price is 15, the oldest price, which is 10, drops out. The new set becomes:
Step 3: Add the updated five prices.
11 + 12 + 11 + 14 + 15 = 63
Step 4: Divide the new total by 5.
63 / 5 = 12.6
The new 5 period SMA is 12.6
That rolling update is why the average moves across the chart. Each new candle adds one price, and the oldest price drops out.
How to Use the Simple Moving Average (SMA)?
Traders use the SMA to judge trend direction, treat it as dynamic support/resistance and watch for crossovers called Golden Cross and Death Cross.
Identifying Trend Direction
The SMA helps define trend direction by showing whether price is generally above or below the average. A rising SMA with price above the line usually supports an uptrend view.
A falling SMA with price below the line usually supports a downtrend view.
The slope matters. A flat SMA often signals weak momentum or a range.
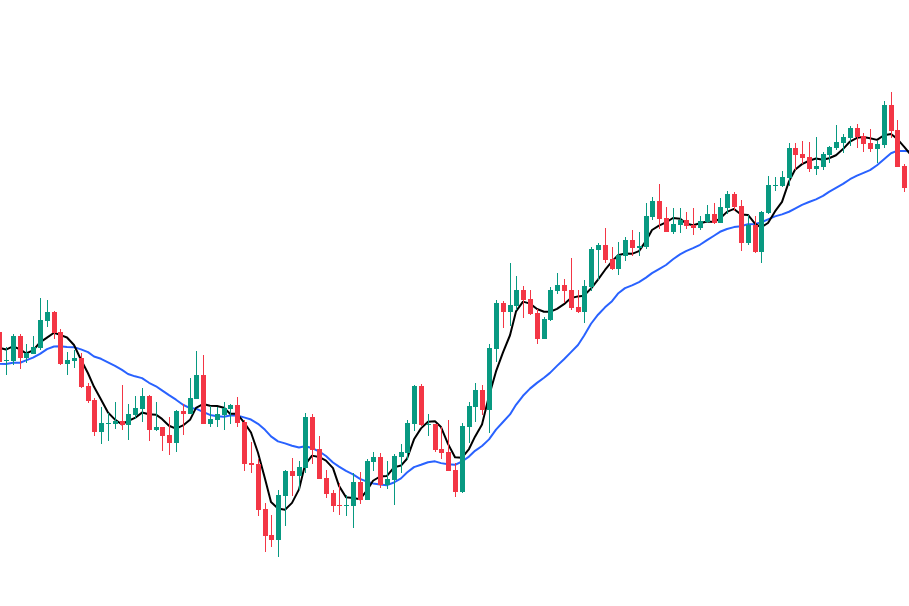
Support and Resistance
The SMA can act as dynamic support or resistance.
In an uptrend, price may pull back into a rising SMA to gain support and rebound upwards. In a downtrend, price may rally into a falling SMA and then reject lower.
SMA Crossover Signals (Golden Cross and Death Cross)
A crossover happens when one moving average crosses another. Traders use crossovers to judge a possible shift in trend strength.
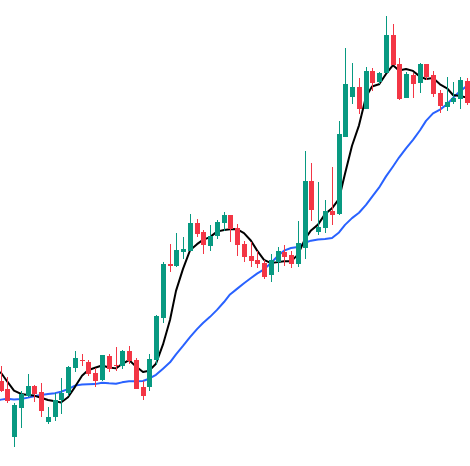
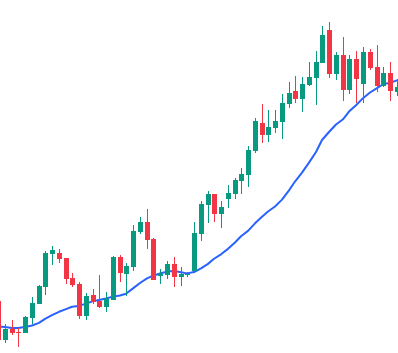
Golden Cross
Golden Cross: Simple Moving Average. Black is 5 days SMA, and Blue is 20 days SMA.
A Golden Cross happens when a shorter SMA crosses above a longer SMA, signaling a strong momentum of price consistently closing above the average.
Death Cross
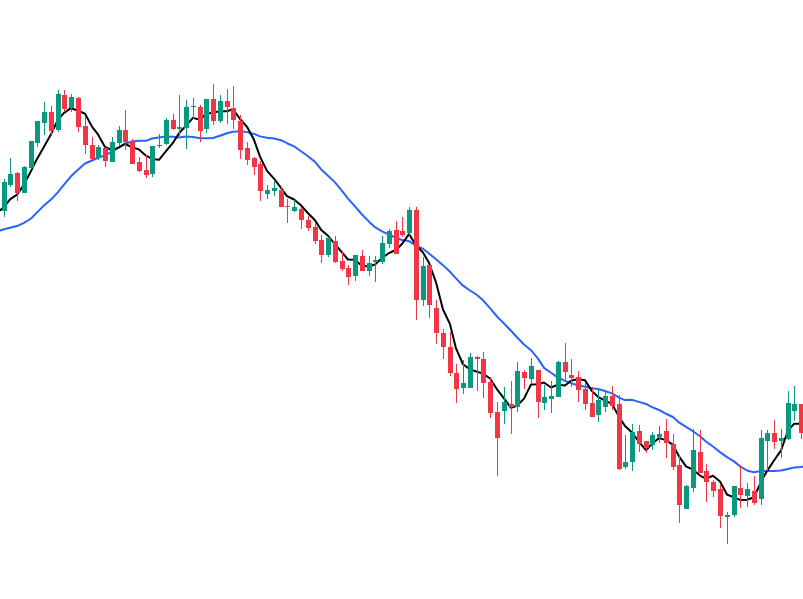
Death Cross: Simple Moving Average. Black is 5 days SMA, and Blue is 20 days SMA.
A Death Cross happens when a shorter SMA crosses below a longer SMA, signaling a weakening momentum leading to the prices to respect the longer SMA as the dynamic resistance level.
Common SMA Periods and What They Mean
Different SMA periods suit different trading horizons. Shorter periods react faster. Longer periods filter more noise.
The best setting depends on the time frame and objective.
Using SMA with Other Indicators
The SMA works better when traders use it with confluence. Confluence means a second signal supports the same market direction.
Useful confluence for SMA includes:
A breakout from a chart pattern that holds above the SMA
RSI confirming momentum in the same direction
MACD confirming trend continuation
Volume expanding on the move away from the SMA
Pro Tip: Use the SMA to define market bias first. Use confluence to judge entry quality.
Risk Management When Using the SMA
The SMA is a structure tool, not a self-sufficient trading system.
How to Set a Stop Loss with the SMA
An SMA should not be the exact stop level. Price often trades slightly above or below the line before the trend resumes.
A better method is to place the stop beyond the price structure that proves the trade wrong. In a long setup, that usually means below the recent swing low and below the relevant SMA. In a short setup, that usually means above the recent swing high and above the relevant SMA.
Why You Should Not Rely on SMA Alone
The SMA is a lagging indicator. A late signal becomes less reliable when the market is sideways, when volatility spikes, or when the signal conflicts with higher time frame structure.
SMA is often used as a dynamic reference tool for support/resistance and trend identification, hence requiring more context and signals to build a complete trading plan.
Advantages and Limitations of the SMA
The SMA smooths price data and makes trend direction easier to read, which is why traders use it as a basic trend filter. Its main limitation is lag, because it reacts more slowly than price and more slowly than faster averages when the market changes quickly.
Advantages
Multi-purpose: It overlays for trend, momentum and dynamic support/resistance.
Easy to interpret: Price relative to the SMA gives quick trend context.
Reduce Noise: Price data can be very chaotic over time, and SMA smoothens it out making it easier to read.
Limitations
Slow Reaction: The line updates after the price has already moved.
Weak in sideways markets: Repeated crosses bring no valuable information.
SMA vs EMA: What Is the Difference?
The main difference between the SMA and the Exponential Moving Average (EMA) is weightage. The SMA gives equal weight to all prices in the period. The EMA gives more weight to recent prices.
That difference changes how each line behaves. The SMA is smoother and slower. The EMA is faster and more sensitive to short term price changes.
Simple Moving Average FAQ
Which Is Better, EMA or SMA?
Neither average is always better. The SMA is better for smoother trend reading, while the EMA is better for faster reaction to recent price changes.
What Does 50 SMA Mean?
A 50 SMA is the average closing price of the last 50 periods. Traders use the 50 SMA to judge intermediate trend direction and to track dynamic support or resistance.
Should Traders Use 200 EMA or 200 SMA?
The choice depends on the goal. A 200 SMA gives a smoother long term trend filter, while a 200 EMA reacts faster to recent price changes.


