


Introduction to Trend Trading

Trend trading is a method that aims to capture gains by analyzing an asset's momentum in a particular direction. This approach is based on the premise that financial instruments often move in discernible trends, and by identifying these trends early, traders can profit from riding the momentum.
While no single indicator can guarantee market success, certain strategies have stood the test of time and remain invaluable tools for trend traders. Effective trading also requires solid risk management, a deep understanding of trading psychology, and continuous education.
Moving Averages: Smoothing Out the Noise
Moving averages (MAs) are fundamental tools in technical analysis. They create a constantly updated average price that smooths out random fluctuations. By eliminating short-term price volatility, they help traders identify the overall direction of a trend.
Key Points:
Popular choices include 200-day, 100-day, and 50-day simple moving averages (SMAs)
It can be used to identify trend direction support/resistance levels and generate trading signals
Crossovers between different moving averages can indicate potential trend changes
Exponential Moving Averages (EMAs) give more weight to recent prices and react faster to price changes
Practical Application:
Uptrend: Moving average line angled upwards
Buy Signal: When a shorter-term MA crosses above a longer-term MA (e.g., 50-day crossing above 200-day, known as the "Golden Cross")
Sell Signal: When a shorter-term MA crosses below a longer-term MA (e.g., 50-day crossing below 200-day, known as the "Death Cross")
Support/Resistance: Price often bounces off moving average lines, particularly the 200-day MA
Advanced Strategies:
Multiple MA Confluence: To confirm trend strength, use multiple MAs (e.g., 20, 50, and 200-day). A strong trend is observed when all MAs are aligned and properly ordered.
MA Ribbon: Plot several MAs close together to form a ribbon. The ribbon's expansion and contraction can indicate trend strength and potential reversals.
Example:
Let's say you're analyzing the EUR/USD forex pair. The 50-day MA has just crossed above the 200-day MA, forming a Golden Cross. This could signal the opening of a long position, especially if other indicators confirm the bullish trend.
Moving Average Convergence Divergence (MACD): Momentum and Trend Following
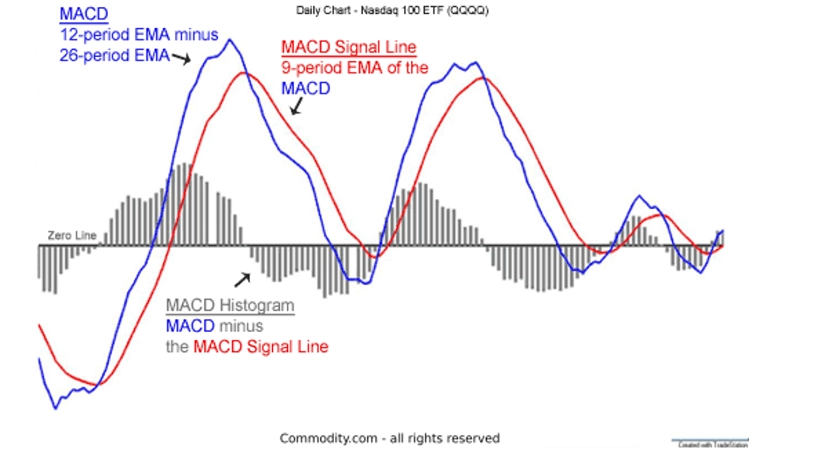
The MACD is a versatile oscillator that combines trend-following and momentum indicators. It's calculated by subtracting the 26-period EMA from the 12-period EMA and is displayed with a 9-period EMA signal line.
Key Points:
It consists of two lines: a fast line (MACD line) and a slow line (signal line), plus a histogram
Provides insights into both trend direction and momentum
Can generate buy/sell signals through line crossovers and zero-line crossings
Divergences between MACD and price can signal potential trend reversals
Practical Application:
Uptrend: MACD lines above zero
Buy Signal: The fast line crosses above the slow line
Sell Signal: The fast line crosses below slow line
Increasing Momentum: Histogram bars growing larger
Decreasing Momentum: Histogram bars shrinking
Advanced Strategies:
MACD Histogram Divergence: Look for divergences between the MACD histogram and price. If the price makes higher highs but the histogram makes lower highs, it could signal a weakening uptrend.
Zero Line Rejections: When the MACD approaches the zero line but fails to cross it before moving back toward the trend, it can be a powerful continuation signal.
Example:
Imagine you're trading gold futures. The price has been in an uptrend, and you notice the MACD line crossing above the signal line while both are above zero. This could be a strong buy signal, indicating that the uptrend is likely to continue with increasing momentum.
Relative Strength Index (RSI): Measuring Overbought and Oversold Conditions
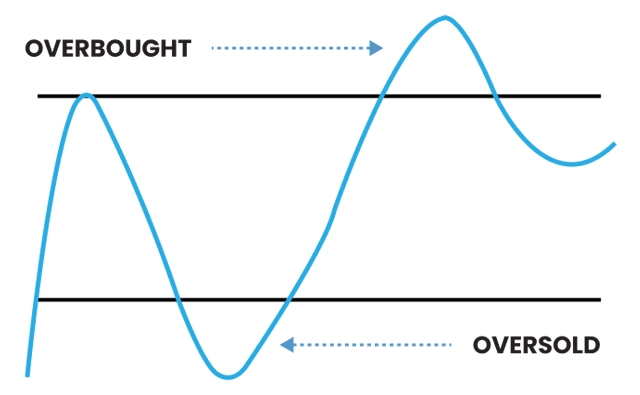
The RSI is an oscillator that moves between 0 and 100. It helps traders identify potential reversals and trend strength by measuring the speed and change of price movements.
Key Points:
The traditional overbought level at 70, oversold at 30
In strong trends, these levels may need adjustment (e.g., 80/20 in strong trends)
It can be used to confirm trend direction and spot divergences
RSI can form chart patterns like double tops or bottoms
Practical Application:
Uptrend: RSI consistently reaching 70 and above
Downtrend: RSI consistently reaching 30 and below
Buy Signal in Uptrend: RSI drops below 50, then rises back above it
Sell Signal in Downtrend: RSI rises above 50, then drops back below it
Divergence: Price making new highs while RSI fails to do so (potential reversal signal)
Advanced Strategies:
RSI Range Shifts: The RSI may establish a new range in strong trends. For example, in a strong uptrend, it might oscillate between 40 and 80 instead of 30 and 70.
Failure Swings: A failure swing above 70 or below 30 can be a strong reversal signal. For example, if RSI moves above 70, pulls back, and fails to reach 70 on the next push-up, it could signal a bearish reversal.
Example:
Consider a scenario where you're trading the S&P 500 index. The price has been rising steadily, but you notice that while the price is making new highs, the RSI is making lower highs. This bearish divergence could be a warning sign that the uptrend is losing steam, and a reversal might be imminent.
On-Balance Volume (OBV): Volume Confirmation of Price Trends

OBV is a cumulative indicator that relates volume to price change, helping confirm the strength of trends. It's based on the idea that volume precedes price movements.
Key Points:
Adds volume on up days, subtracts on down days
Should ideally move in the same direction as the price trend
Divergences can signal potential reversals
It helps identify accumulation and distribution phases
Practical Application:
Trend Confirmation: OBV rising with price in an uptrend
Leading Indicator: OBV rising while the price is flat suggests a potential upward breakout
Divergence: OBV falling while price rising may indicate a weakening uptrend
Breakout Confirmation: A price breakout accompanied by a surge in OBV suggests a strong, valid breakout
Advanced Strategies:
OBV Moving Average: Apply a moving average to the OBV line. Crossovers between the OBV and its MA can generate trading signals.
Volume-Price Confirmation: Use OBV in conjunction with price action. For example, a bullish engulfing candle accompanied by a sharp rise in OBV could be a strong buy signal.
Example:
Let's say you're analyzing a tech stock consolidating in a tight range. You notice that while the price has been flat, the OBV has steadily risen. This could indicate accumulation and foreshadow an upward breakout, presenting a potential buying opportunity before the breakout occurs.
Combining Indicators for Enhanced Trend Trading
While each indicator is powerful, combining them can provide more robust trading signals and help filter out false positives. Here are some ways to use these indicators in tandem:
Trend Confirmation: Use Moving Averages to establish the overall trend, then use MACD for entry timing.
Momentum Validation: Confirm MACD signals with RSI readings. For example, a MACD bullish crossover is more reliable if the RSI is rising and below 70.
Volume Verification: Use OBV to confirm the strength of trends identified by Moving Averages and MACD.
Divergence Detection: Look for divergences across multiple indicators. If price, MACD, RSI, and OBV all show divergence, it's a strong reversal signal.
Remember, while combining indicators can provide more robust signals, it can also lead to analysis paralysis. It's crucial to have a clear trading plan and not to over-complicate your strategy.
Risk Management in Trend Trading
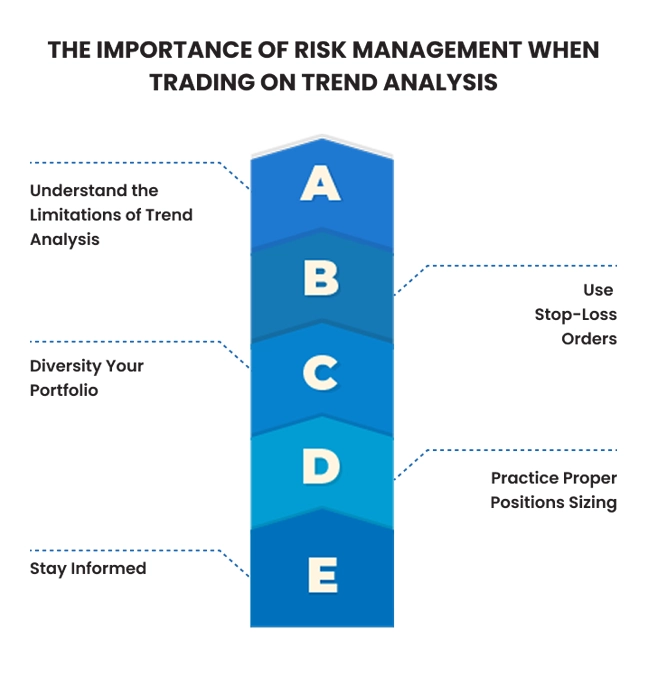
While identifying trends is crucial, managing risk is equally important for long-term trading success. Here are some key risk management principles to incorporate into your trend trading strategy:
Position Sizing: Never risk more than a small percentage (typically 1-2%) of your trading capital on a single trade.
Stop-Loss Orders: Always use stop-loss orders to limit potential losses if a trend reverses.
Trailing Stops: In strong trends, use trailing stops to lock in profits while letting winners run.
Correlation Awareness: Be cautious about taking on multiple trend trades in highly correlated assets, as this can increase overall portfolio risk.
Market Context: Consider the broader market context and potential upcoming events that could impact your trades.
Empowering Your Trading with TMGM
Understanding and effectively using these trend trading indicators can significantly enhance your ability to identify and capitalize on market trends. However, it's important to remember that no indicator is infallible, and combining multiple indicators often yields the best results.
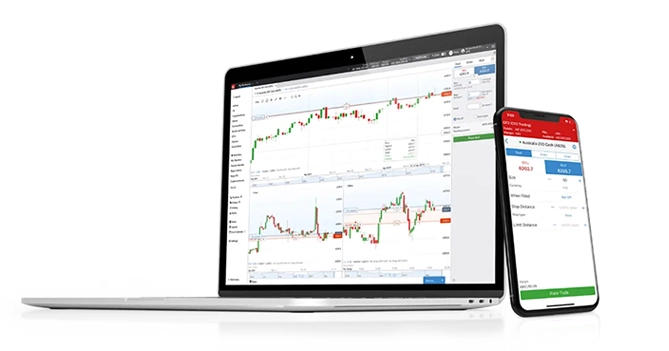
TMGM is committed to providing our clients the education, tools, and support to navigate the complex world of forex and CFD trading. Our advanced trading platforms offer access to these indicators and many more, allowing you to implement sophisticated trend trading strategies easily.
Whether you're a seasoned trader or just starting your journey, TMGM offers a range of resources to help you refine your skills and make informed trading decisions. From expert market analysis to personalized support, we're here to help you succeed in your trading endeavors.
Ready to put these trend trading strategies into practice?
Open an account with TMGM today and experience the difference that comes with trading alongside a world-class broker. Our platforms feature:
Advanced charting capabilities with customizable indicators
Real-time market data and news feeds
Risk management tools, including guaranteed stop-loss orders
Educational resources, including webinars, tutorials, and one-on-one coaching
Visit our website to learn more about our competitive spreads, advanced platforms, and comprehensive educational resources.
Remember, successful trading is a journey of continuous learning and adaptation. Stay informed, practice sound risk management, and never stop refining your strategy.
With TMGM by your side, you're well-equipped to tackle the exciting challenges of trend trading in today's dynamic markets.
Start your trend trading journey with TMGM today and unlock your potential in the financial markets!


