


- The Euro maintains its firm tone against the Pound and tests 2025 highs, at 0.8830.
- Hopes of further BoE rate cuts are weighing on the Sterling.
- Technically, the EUR/GBP remains bullish with the next upside target at the its0.8900 area.
The Euro is heading north for the second consecutive day against a weak British Pound. The pair bounced up from 0.8770 to retrace losses from the previous four trading days and is now testing the year-to-date high, at 0.8830.
The Sterling remains on its back foot, weighed by the downbeat UK employment data released on Tuesday, which showed the highest Unemployment Rate in the last four years. UK data increased pressure on the Bank of England to lower borrowing costs further at its December meeting, while the ECB is likely to keep its monetary policy unchanged for some time.
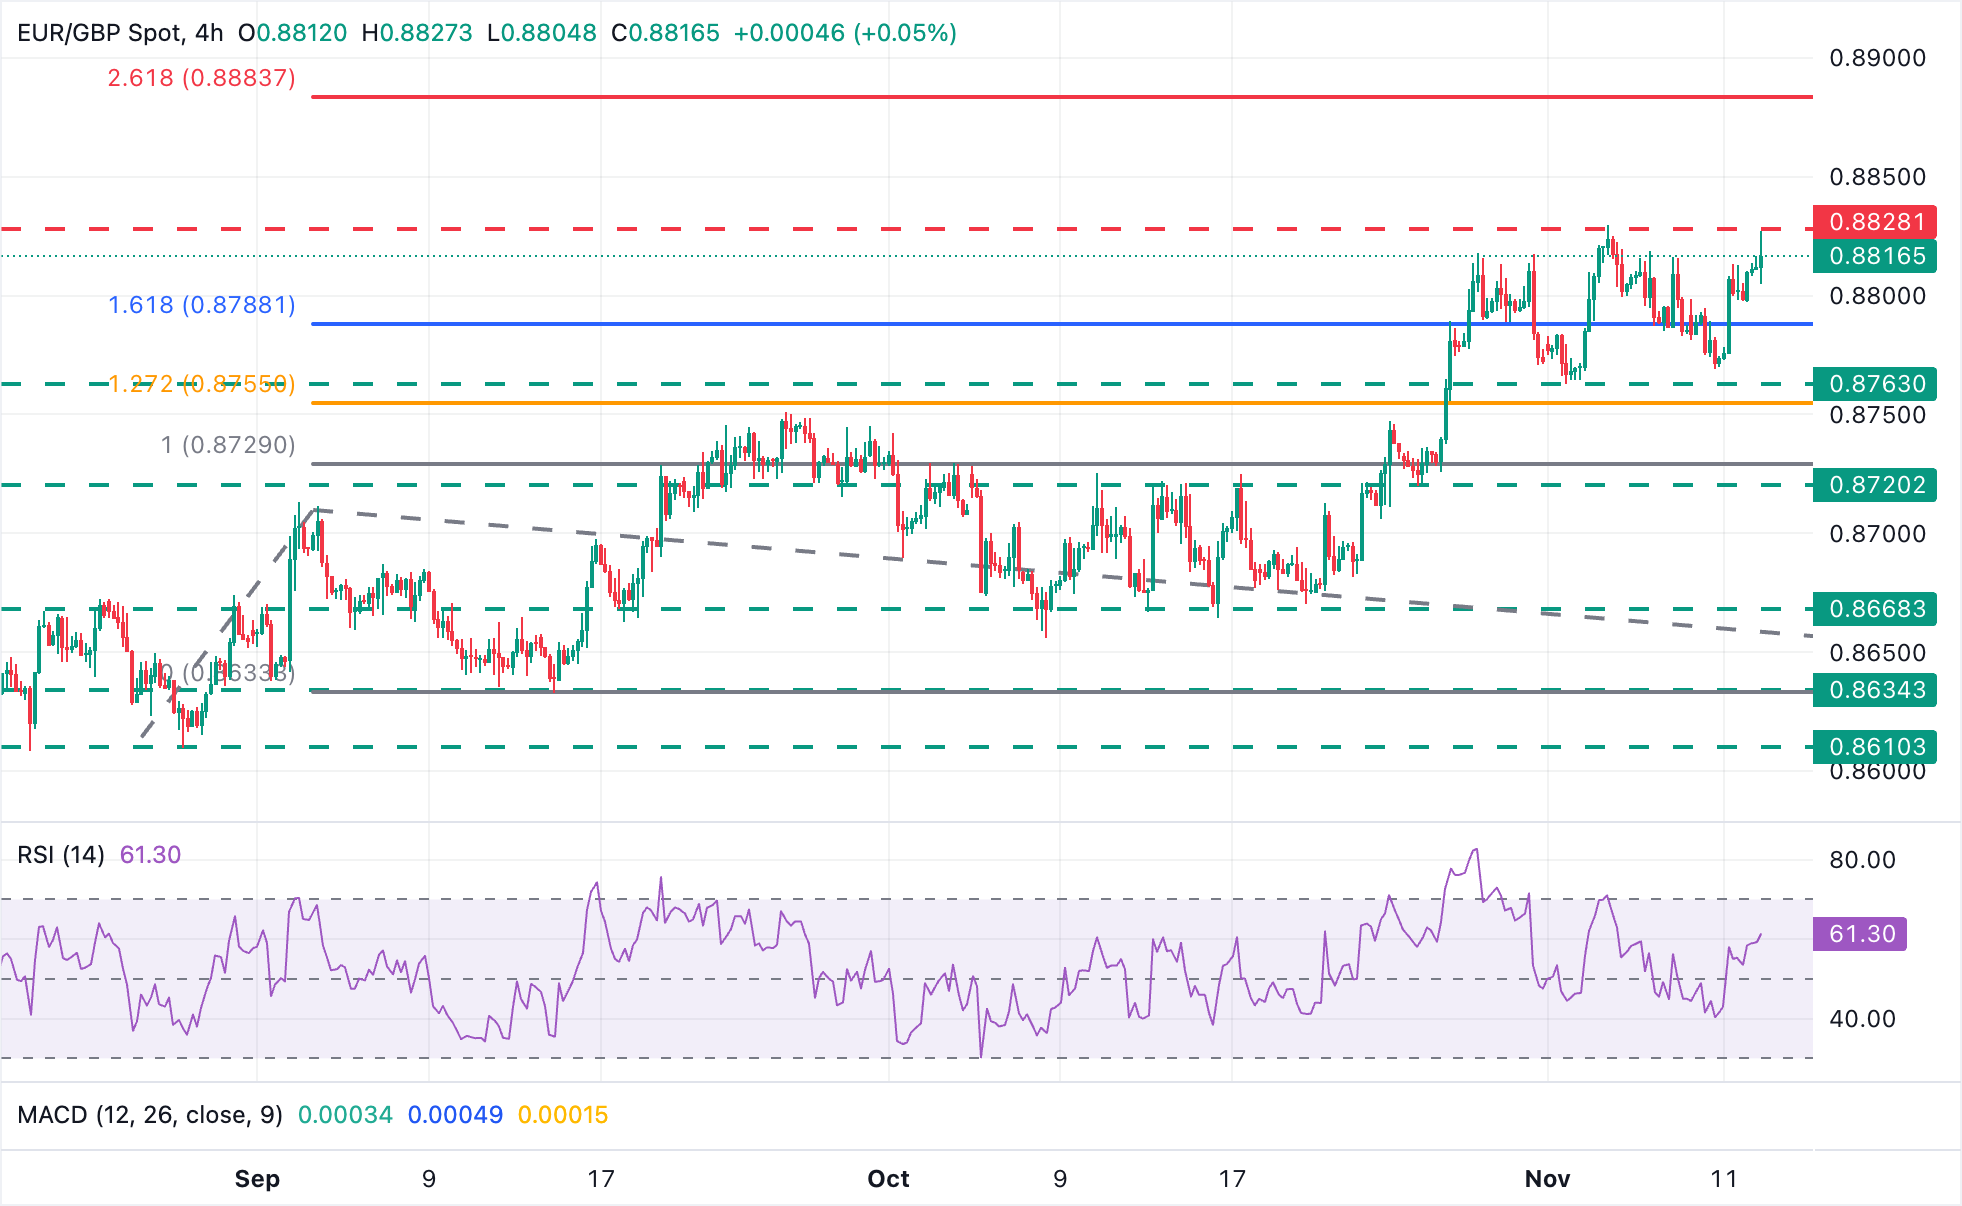
Technically, the pair remains on a bullish trend from late August lows near 0.8600, with bulls focusing on 0.8630 (the November 5 high). Further up, the 261.8% Fibonacci extension of the August 27-September 2 bull run, near 0.8885, and the 0.8900 area, emerge as the next potential targets.
A reversal from current levels, on the contrary, would seek support at the November 4 low of 0.8760 ahead of the October 27 low, at 0.8720, and the October 21 low, at the 0.8670 area.
Pound Sterling Price Today
The table below shows the percentage change of British Pound (GBP) against listed major currencies today. British Pound was the strongest against the Japanese Yen.
| USD | EUR | GBP | JPY | CAD | AUD | NZD | CHF | |
|---|---|---|---|---|---|---|---|---|
| USD | 0.09% | 0.28% | 0.48% | 0.05% | -0.07% | 0.00% | -0.14% | |
| EUR | -0.09% | 0.19% | 0.39% | -0.04% | -0.16% | -0.08% | -0.23% | |
| GBP | -0.28% | -0.19% | 0.22% | -0.23% | -0.34% | -0.27% | -0.42% | |
| JPY | -0.48% | -0.39% | -0.22% | -0.43% | -0.55% | -0.48% | -0.62% | |
| CAD | -0.05% | 0.04% | 0.23% | 0.43% | -0.11% | -0.05% | -0.20% | |
| AUD | 0.07% | 0.16% | 0.34% | 0.55% | 0.11% | 0.07% | -0.06% | |
| NZD | -0.01% | 0.08% | 0.27% | 0.48% | 0.05% | -0.07% | -0.15% | |
| CHF | 0.14% | 0.23% | 0.42% | 0.62% | 0.20% | 0.06% | 0.15% |
The heat map shows percentage changes of major currencies against each other. The base currency is picked from the left column, while the quote currency is picked from the top row. For example, if you pick the British Pound from the left column and move along the horizontal line to the US Dollar, the percentage change displayed in the box will represent GBP (base)/USD (quote).
the


