


- XRP struggles to recover from support at $2.10 amid risk-off sentiment.
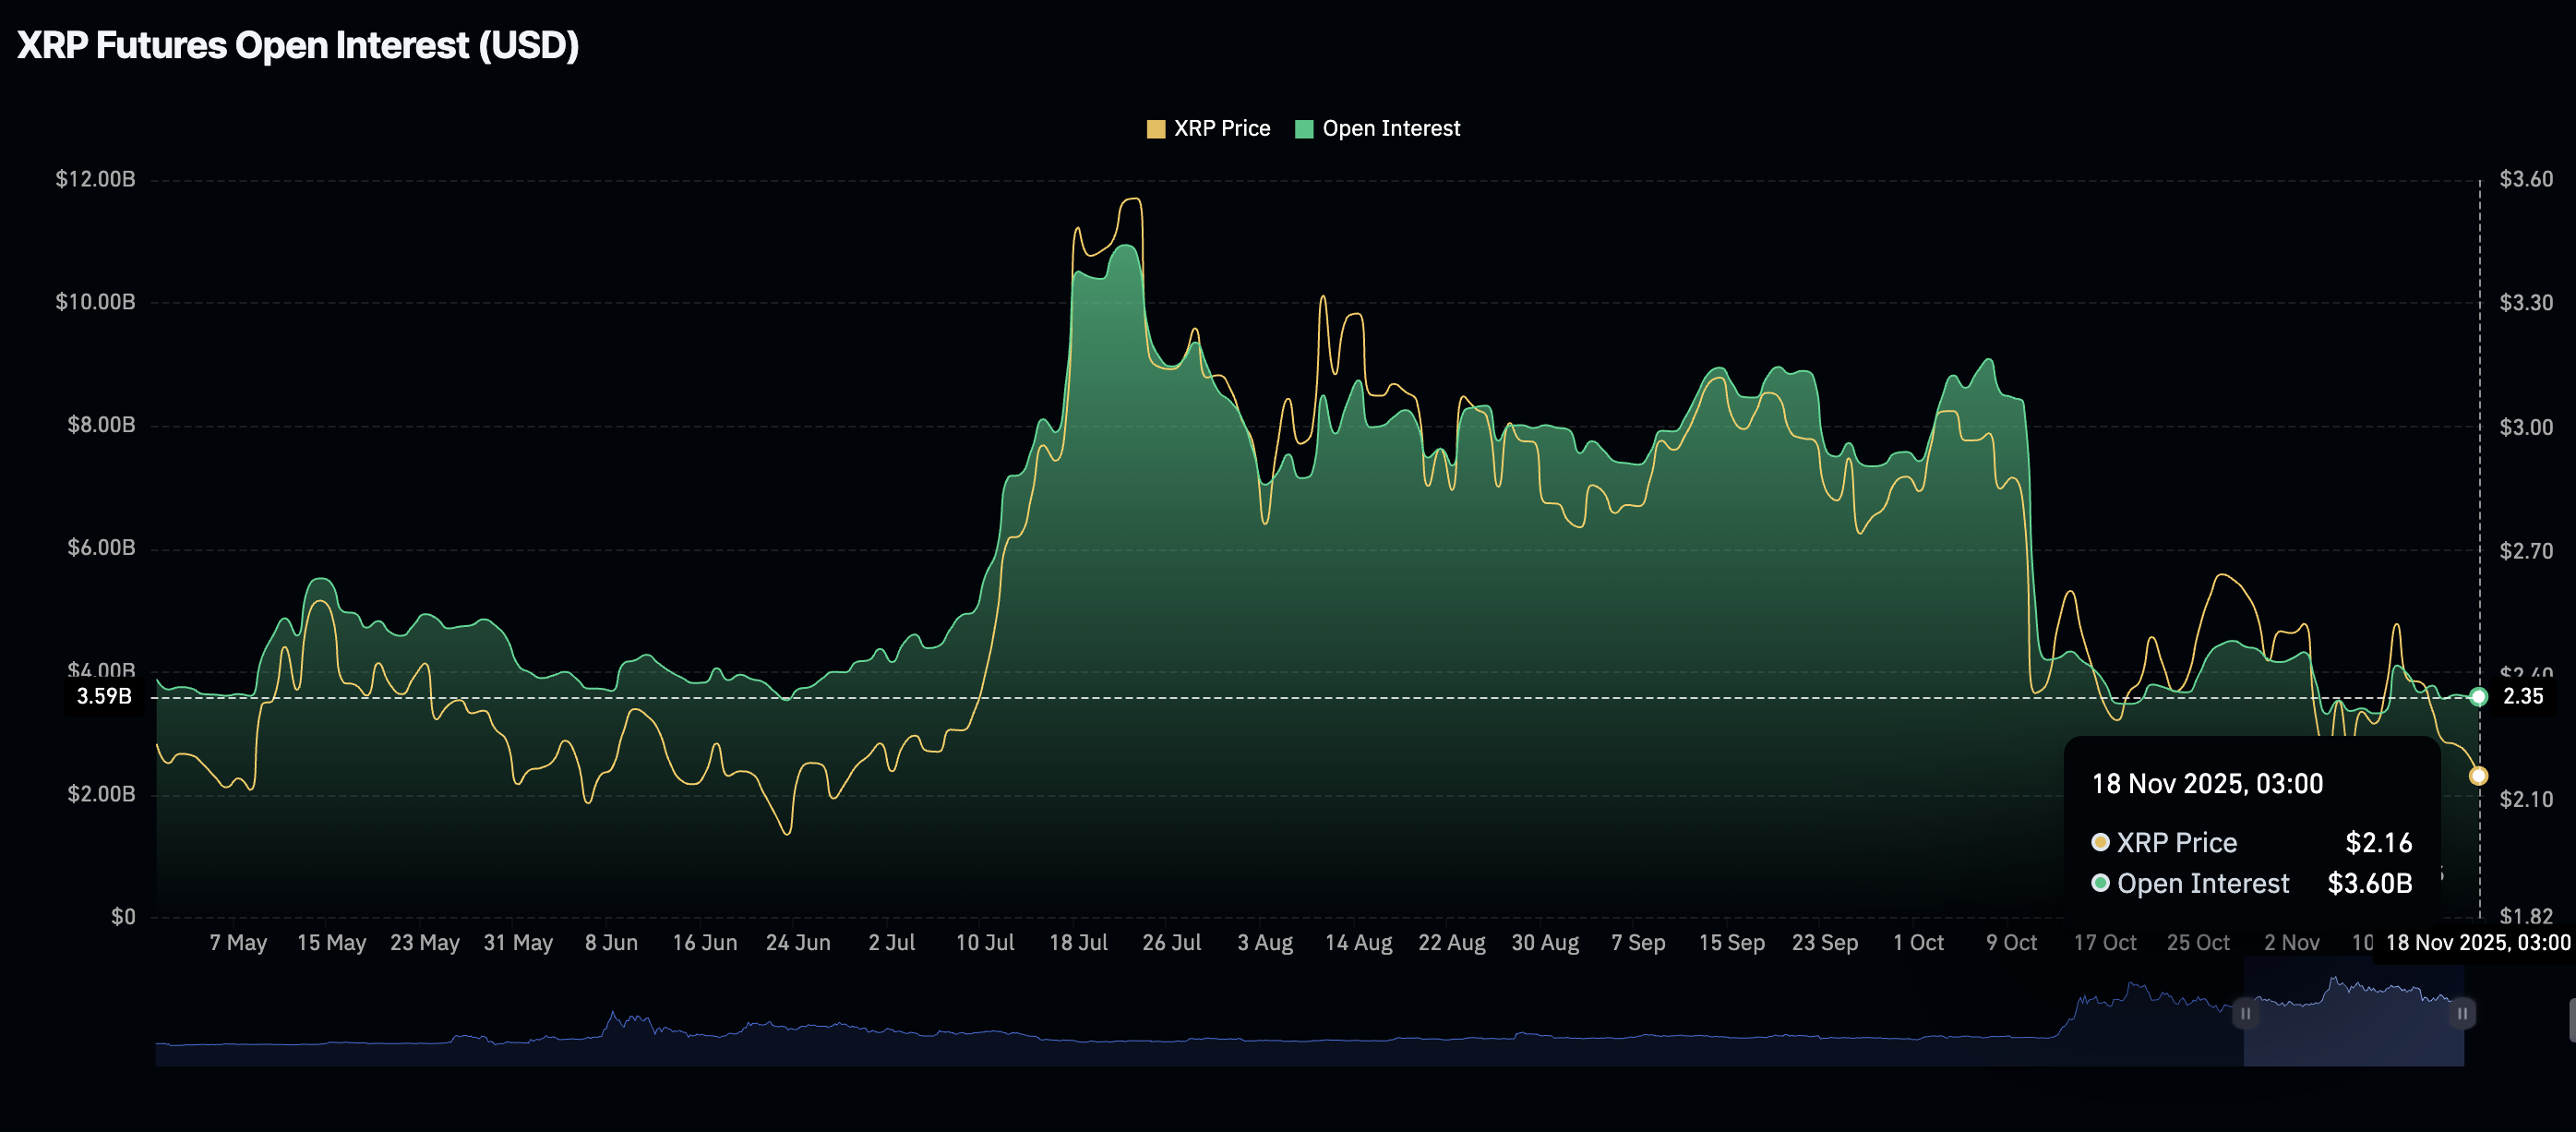
- Retail demand for XRO remains significantly low with futures Open Interest at $3.78 billion.
- A downward trending RSI and a MACD sell signal underscore the weak technical structure.
Ripple (XRP) is trading above its short-term support at $2.10 at the time of writing on Tuesday as uncertainty takes root in the broader cryptocurrency market.
Low retail and institutional demand, the lack of strong price catalysts, and sticky risk-off sentiment are among the factors weighing on the cross-border remittance token.
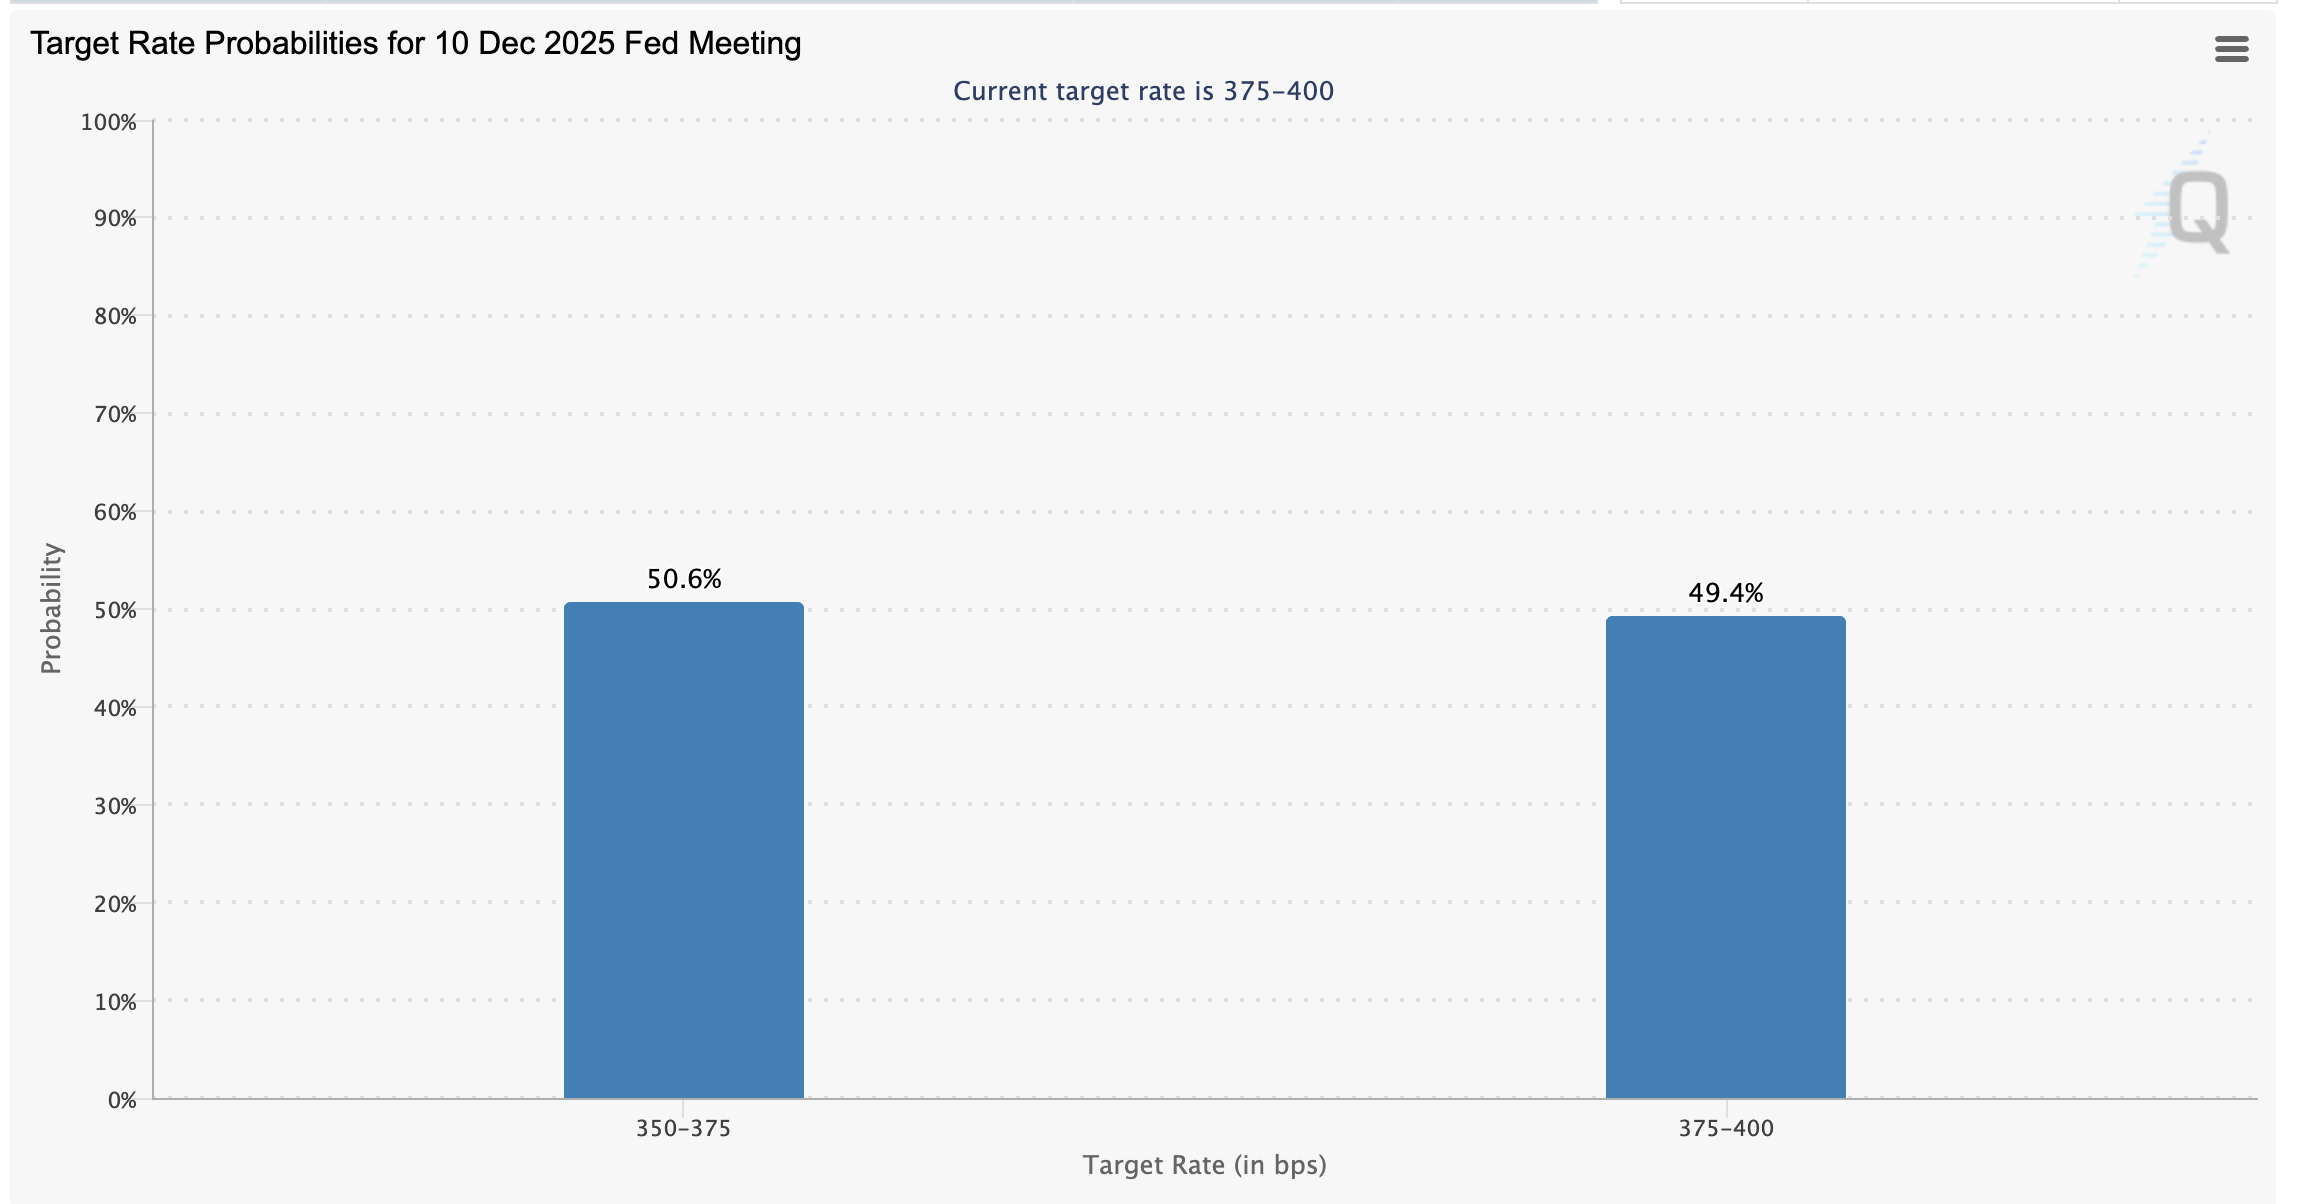
Since October’s interest rate cut, sentiment has dimmed, as investors in riskier assets price in the possibility of a pause on monetary policy easing in the next Federal Reserve (Fed) meeting on December 10.
Fed Chair Jerome Powell said during the policy meeting in November, which saw a 25-basis-point rate cut to a range of 3.75% to 4.00%, that further easing this year was not a guarantee.
According to CME Group’s FedWatch Tool, the market is split between expecting another 25-basis-point cut or a pause. Approximately 50.6% of market participants expect the Fed to go ahead with the rate cut, while 49.4% anticipate a pause, leaving the rate unchanged in the range of 3.75% to 4.00%.
XRP weakens as retail demand shrinks
XRP futures Open Interest (OI) highlights a weak derivatives market averaging $3.6 billion on Tuesday. Since OI represents the notional value of outstanding futures contracts, sideways movement suggests muted interest. Traders are less convinced that XRP can sustain recovery in the short term. They are reducing their exposure to risk or staying on the sidelines, which contributes to selling pressure and risk-off sentiment.
Technical outlook: XRP recovery could stall further
XRP hovers above support at $2.10 at the time of writing on Tuesday as bulls struggle to gain control. The Relative Strength Index (RSI) at 38 on the daily chart is showing early signs of stability. If the RSI rebounds toward the bullish zone, it could help strengthen XRP’s short-term bullish outlook.
However, traders should be cautiously optimistic, considering the Moving Average Convergence Divergence (MACD) indicator has maintained a sell signal since Sunday, which may continue to call for risk-averse action among investors.
XRP also sits below key moving averages, including the 50-day Exponential Moving Average (EMA) at $2.49, the 200-day EMA at $2.55, and the 100-day EMA at $2.59, which emphasize the bearish sentiment. Key areas of interest for traders are $2.07, which was tested on November 4, and $1.90, tested in June.
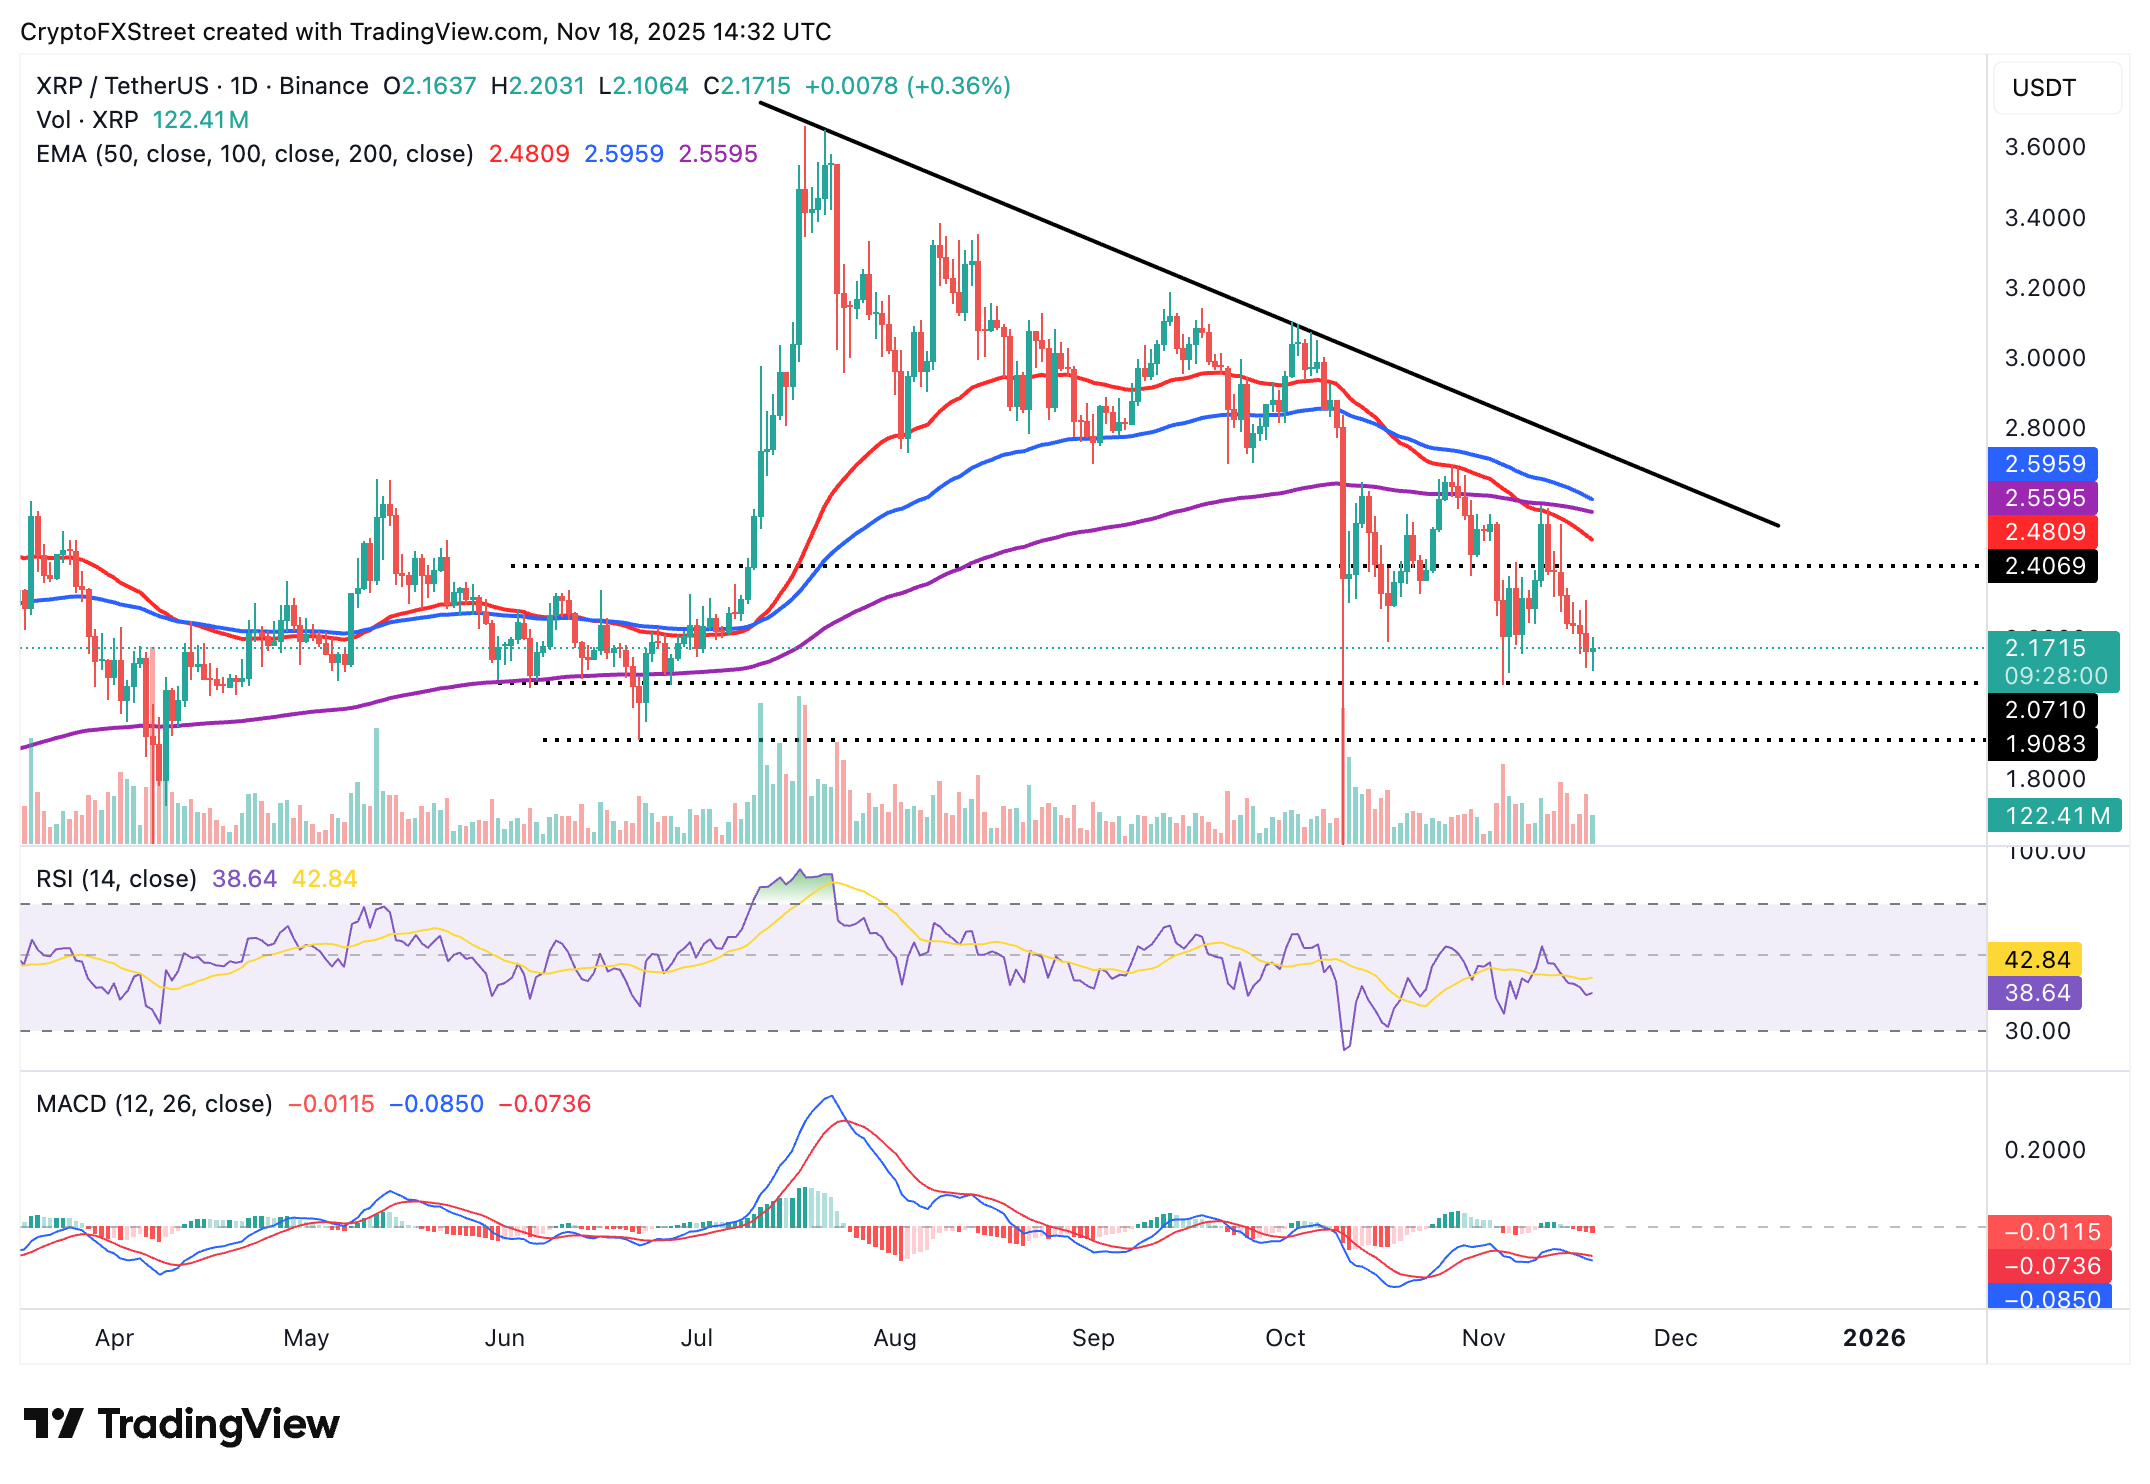
Still, if investors identify key entry zones and increase exposure in upcoming sessions, XRP could steady its recovery toward the 50-day EMA at $2.49.
Cryptocurrency metrics FAQs
The developer or creator of each cryptocurrency decides on the total number of tokens that can be minted or issued. Only a certain number of these assets can be minted by mining, staking or other mechanisms. This is defined by the algorithm of the underlying blockchain technology. On the other hand, circulating supply can also be decreased via actions such as burning tokens, or mistakenly sending assets to addresses of other incompatible blockchains.
Market capitalization is the result of multiplying the circulating supply of a certain asset by the asset’s current market value.
Trading volume refers to the total number of tokens for a specific asset that has been transacted or exchanged between buyers and sellers within set trading hours, for example, 24 hours. It is used to gauge market sentiment, this metric combines all volumes on centralized exchanges and decentralized exchanges. Increasing trading volume often denotes the demand for a certain asset as more people are buying and selling the cryptocurrency.
Funding rates are a concept designed to encourage traders to take positions and ensure perpetual contract prices match spot markets. It defines a mechanism by exchanges to ensure that future prices and index prices periodic payments regularly converge. When the funding rate is positive, the price of the perpetual contract is higher than the mark price. This means traders who are bullish and have opened long positions pay traders who are in short positions. On the other hand, a negative funding rate means perpetual prices are below the mark price, and hence traders with short positions pay traders who have opened long positions.


