


ADA price today: $0.37
- ADA investors have booked over $900 million in losses in December.
- Investors who bought ADA in the past 365 days are holding average losses of nearly 40%.
- ADA is testing the resistance near $0.37 after bouncing off $0.34.
Loss realization among Cardano (ADA) holders increased sharply in December, marking one of its heaviest capitulation months since 2023. Since the beginning of the month, investors have realized over $900 million in losses as of Friday.
 [04-1766200998267-1766200998268.21.38, 20 Dec, 2025].png)
The move comes as bearish sentiment following the October 10 crash saw ADA erase all its gains from over the past 14 months.
With prices plunging toward $0.35, all ADA investors are holding an average loss of 40%. Notably, investors who bought the token in the past 365 days are also experiencing losses of a similar size.
As a result, most investors began cutting losses in December.
 [04-1766201047603-1766201047604.22.03, 20 Dec, 2025].png)
Large holders fueled selling activity amid open interest contraction
On the spot market, the intense selling pressure majorly flowed from wallets holding 1M-10M ADA, as their collective holdings dropped by 130M ADA since the beginning of the month.
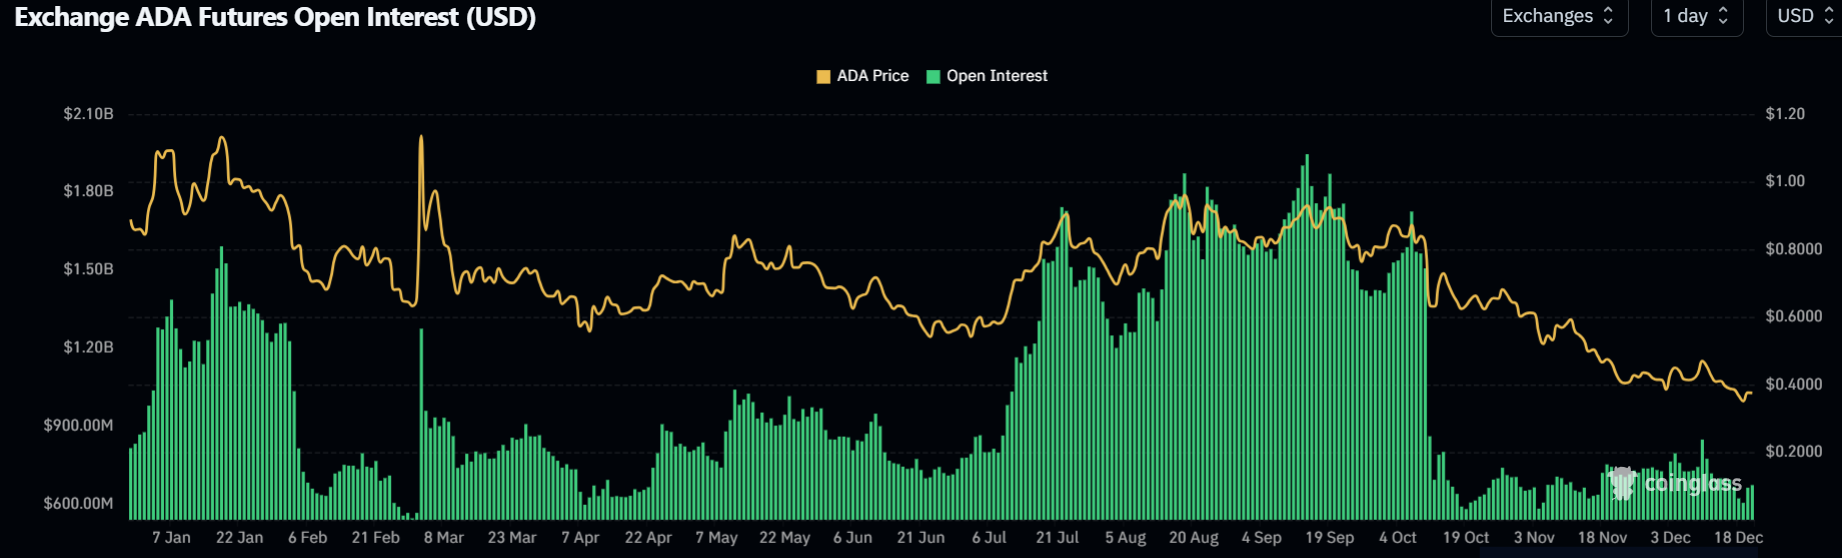
On the derivatives side, ADA's futures open interest remains subdued at around $657 million as of Friday, with market participants staying on the sidelines since the October 10 crash.
ADA is trading at $0.37, up 4% at publication time on Saturday.
Cardano Price Forecast: ADA faces resistance at $0.37
ADA bounced off $0.34 and is testing the $0.37 resistance, near the upper boundary of the descending channel. The channel's resistance is strengthened by the 20-day Exponential Moving Average (EMA), which has proven a key hurdle since October 10.
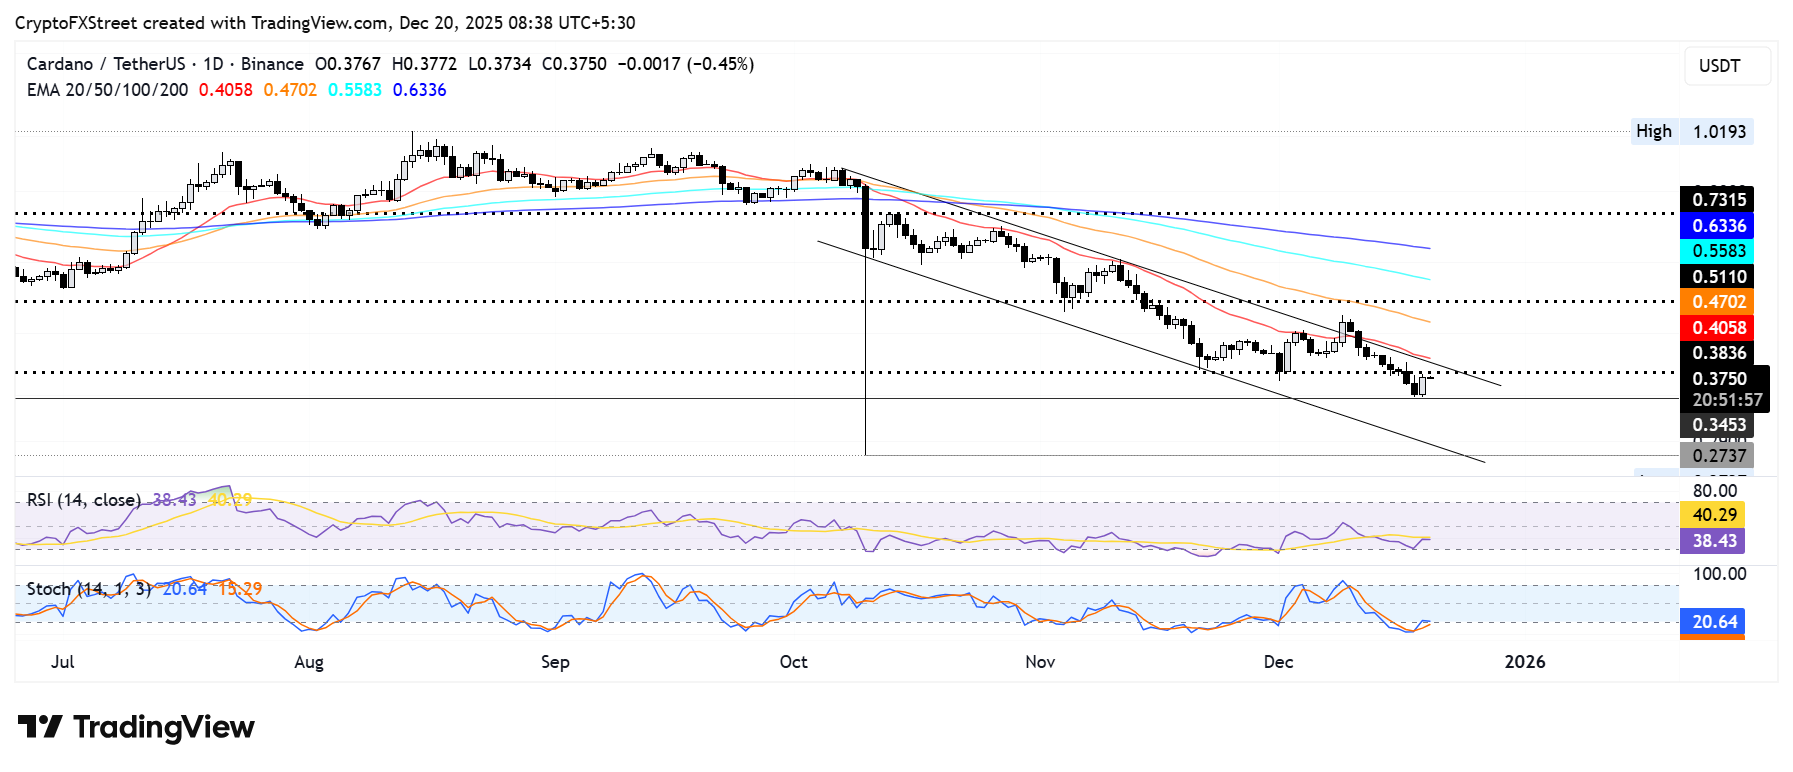
A rise above the descending channel could see ADA test the $0.51 level, but it has to clear the 50-day EMA on the way up. On the downside, ADA could find support at $0.34.
The Relative Strength Index (RSI) is below its neutral level and testing its moving average line. Meanwhile, the Stochastic Oscillator (Stoch) is attempting to recover from oversold conditions.


