


- SPX6900 price hovers around $0.58 on Thursday after rebounding from its key support earlier this week.
- Rising trading volume, increasing large-whale orders, and positive funding rates support the case for further upside.
- Technical indicators signal fading bearish momentum, suggesting the potential for a continued recovery.
SPX6900 (SPX) price is holding near $0.58 at the time of writing on Thursday after rebounding from a key support zone earlier this week. On-chain and derivatives data show strengthening market conditions, with rising trading volume, increasing whale activity and positive funding rates suggesting renewed bullish momentum. Meanwhile, technical indicators also point to fading bearish pressure, supporting the possibility of an extended recovery in SPX.
SPX eyes further upside as whale activity and funding rates improve
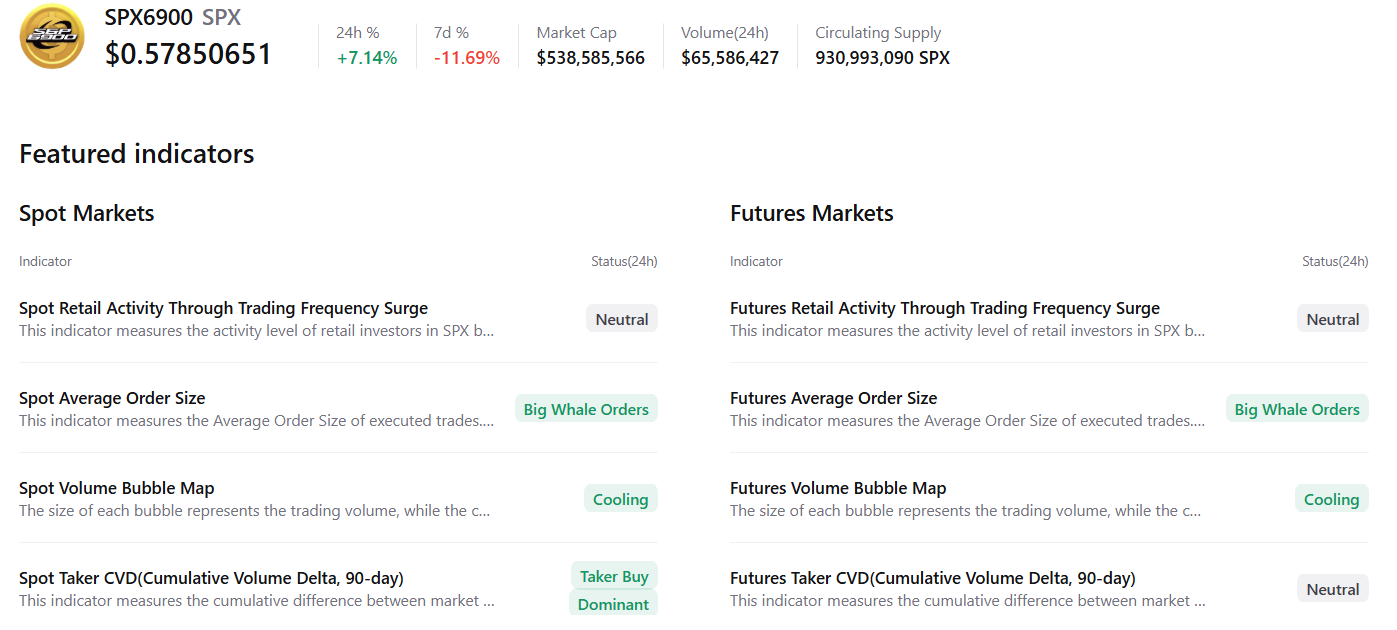
CryptoQuant summary data supports a positive outlook for SPX, as spot and futures markets show large whale orders, easing market conditions, and clear buying dominance, collectively signaling that a recovery rally may be forming.
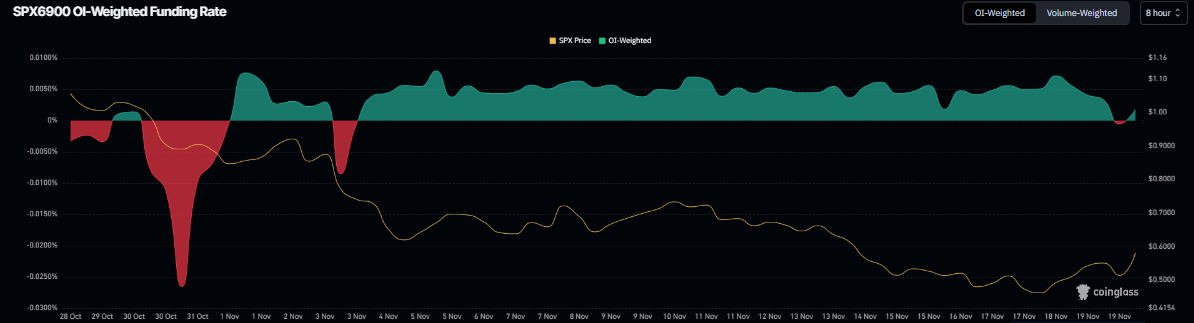
The derivatives data also support a recovery rally for SPX6900, as Coinglass’s OI-Weighted Funding Rate data shows that the number of traders betting that the price of SPX will slide further is lower than those anticipating a price increase.
The metric flipped to a positive rate on Thursday and reads 0.0018%, indicating that longs are paying shorts. Historically, as shown in the chart below, when the funding rates have flipped from negative to positive, the SPX price has rallied sharply.
Santiment data indicate that the SPX ecosystem’s trading volume (the aggregate trading volume generated by all exchange applications on the chain) reached $65.61 million on Thursday, the highest since early November and has been rising constantly since mid-November. This volume rise indicates a surge in traders’ interest and liquidity in SPX6900, boosting its bullish outlook.
 [08-1763609602948-1763609602949.16.44, 20 Nov, 2025].png)
SPX6900 Price Forecast: SPX prepares for a rebound amid improving market structure
SPX6900 price retested and found support around the October 10 low of $0.44 on Monday, then rebounded 26% over the next two days. At the time of writing on Thursday, SPX is trading in green around $0.58.
If SPX continues its recovery, it could extend the rally toward the daily resistance level at $0.94.
The Relative Strength Index (RSI) on the daily chart is 40, rebounding from overbought territory earlier this week, suggesting fading bearish momentum. For the recovery rally to be sustained, the RSI must move above the neutral level. Additionally, the Moving Average Convergence Divergence (MACD) showed a bullish crossover on Wednesday, providing early buy signals and supporting the case for an upward trend ahead.
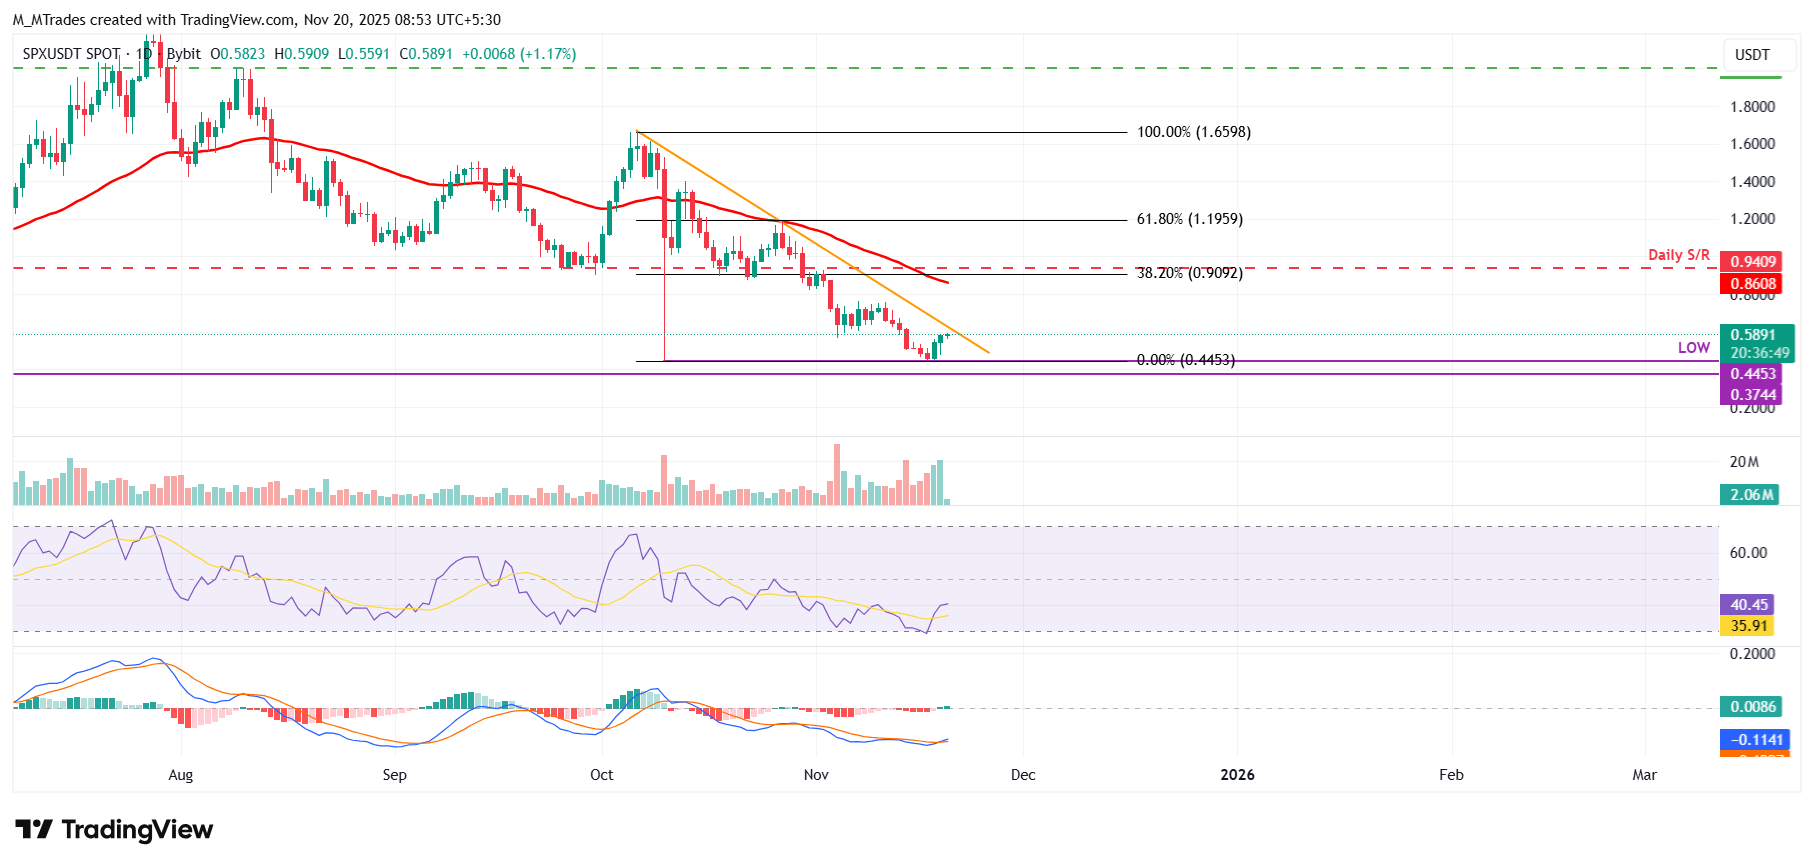
On the other hand, if SPX faces a correction, it could extend the decline toward the October 10 low of $0.44.


