
Trade The World
Dogecoin Price Forecast: DOGE eyes $0.166 resistance after 30% surge
By Michael Ebiekutan
Date Published: 6 Jan 2026 | Date Modified: 6 Jan 2026


POPULAR ARTICLES

Dogecoin (DOGE) has been one of the top performers in the crypto market since the beginning of the new year. The number one memecoin gained nearly 30% over the past four days, outperforming major cryptos amid a rise in the broader market sentiment.
- Dogecoin has gained over 30% in the past four days amid a recovery in the general memecoin category.
- The recent rebound in memecoins follows historic lows in the meme-to-altcoin dominance ratio.
- DOGE has risen above the 50-day EMA and could tackle the $0.166 resistance.
Dogecoin (DOGE) has been one of the top performers in the crypto market since the beginning of the new year. The number one memecoin gained nearly 30% over the past four days, outperforming major cryptos amid a rise in the broader market sentiment.
The move is reflected in the 21Shares 2x Dogecoin ETF (TXXD), which is one of the best-performing ETFs to start 2026, according to Bloomberg ETF analyst Eric Balchunas.
The speculative interest in Dogecoin also improved slightly in the traditional crypto market, with its open interest (OI) rising to 13.47 billion DOGE on January 2 — its highest level since the October 10 leverage flush, per Coinglass data. However, that figure has slightly retreated to 12.68 billion DOGE despite a steady price rise, indicating some scepticism among traders.
Meanwhile, the rise isn't limited to Dogecoin as the broader memecoin category has seen its market capitalization rise over 30% to $47.8 billion in the past four days.
The move follows months of underperformance, with the memecoin to altcoin dominance ratio plunging to historic lows of 0.032 in December. This means that memecoins accounted for only 3% of the general altcoins market cap. However, a massive memecoin season kicked off following the last time the metric reached such levels.
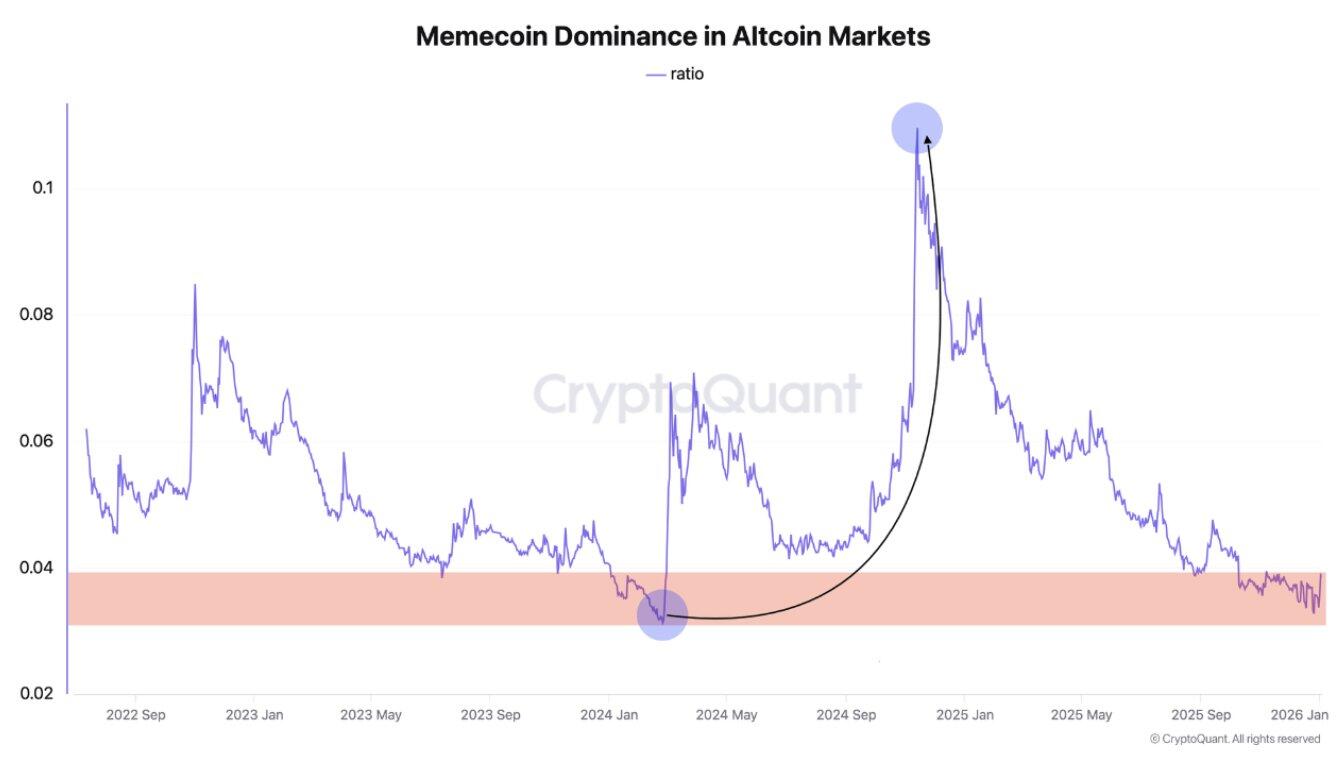
With recent gains across several memecoins, the sector could be hinting at a comeback, according to CryptoQuant contributor Darkfost.
Dogecoin Price Forecast: DOGE could tackle the $0.166 resistance
DOGE has risen above the 50-day Exponential Moving Average (EMA) and is looking to tackle the $0.166 resistance near the 100-day EMA. A rise above could push the top memecoin to tackle the $0.181 hurdle near the 200-day EMA.
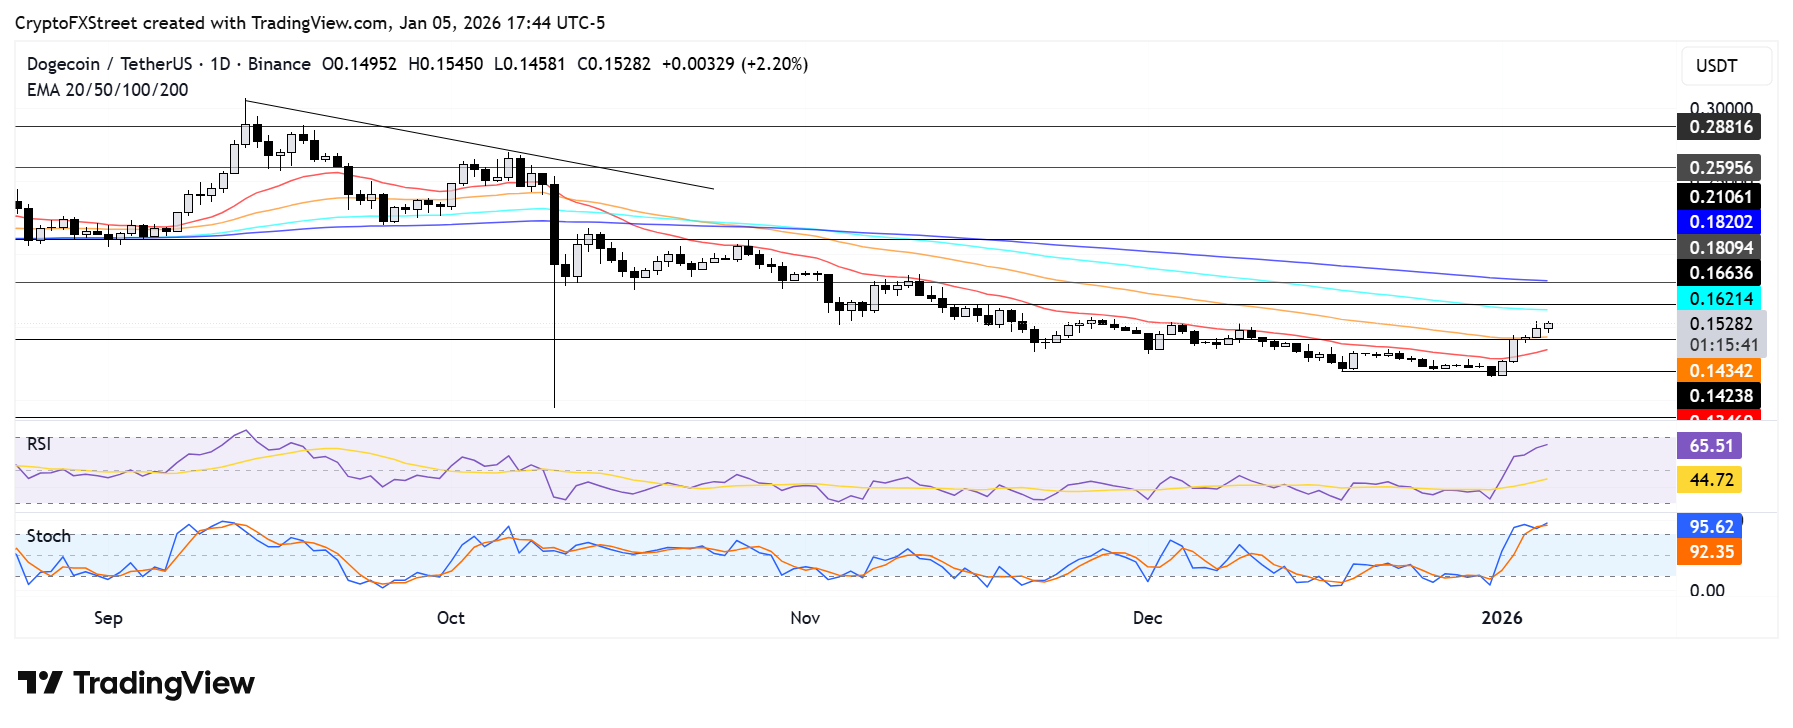
On the downside, Dogecoin could find support at $0.142. A decline below $0.142 and eventually the 20-day EMA could push its price toward $0.121.
The Relative Strength Index (RSI) is above its neutral level, while the Stochastic Oscillator (Stoch) is in its overbought region, indicating a rising bullish momentum. Sustained overbought conditions in the Stoch could spark a pullback.

Acuity Trading
Acuity Trading is a London-based fintech company founded in 2013 that specializes in AI-powered alternative data and sentiment analysis for trading and investments. They revolutionized the online trading experience by introducing visual news and sentiment tools, and today they continue to lead the fintech market with alpha-generating alternative data and highly engaging trading tools using the latest AI research and technology.
Read More


