
Trade The World
EUR/JPY rallies for second day as bullish setup targets 178.00
By Christian Borjon Valencia
Date Published: 16 Sep 2025 | Date Modified: 16 Sep 2025


POPULAR ARTICLES
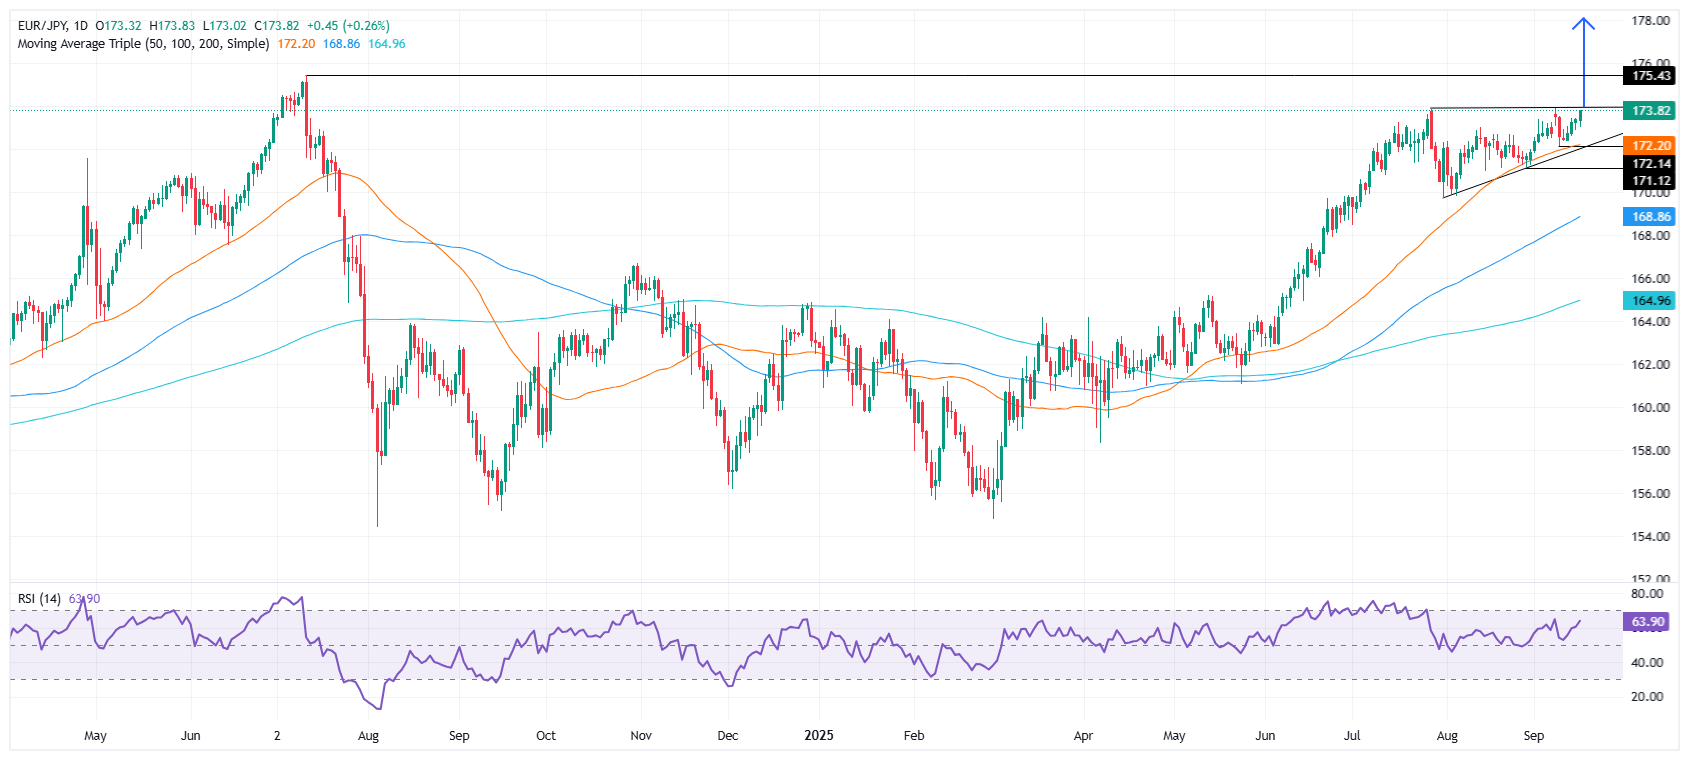
The EUR/JPY trends higher for the second straight day, hits a six-day high of 173.83 as the technical picture, suggests that further upside is seen. At the time of writing, the cross-pair trades at 173.80, up 0.25%.
- EUR/JPY extends rally for second day, trading at 173.80 with bullish technical setup reinforcing upside potential.
- Ascending triangle formation in uptrend suggests buyers could target 174.00, 175.43, and eventually 178.00.
- BoJ hawkish stance to raise rates caps gains, though RSI strength supports continued bullish momentum.
The EUR/JPY trends higher for the second straight day, hits a six-day high of 173.83 as the technical picture, suggests that further upside is seen. At the time of writing, the cross-pair trades at 173.80, up 0.25%.
EUR/JPY Price Forecast: Technical outlook
The formation of an “ascending triangle” in an uptrend, suggests that the EUR/JPY is poised to extend its rally, and post gains of over 300 pips with buyers targeting the 178.00 figure. Nevertheless, fundamental reasons, like the Bank of Japan (BoJ) telegraphing hawkish intentions to hike rates, according to sources, capped the pair’s advance.
The Relative Strength Index (RSI) is bullish and about to clear the latest peak at 64.92, would indicate that flows could push the EUR/JPY higher.
In that outcome, the EUR/JPY first resistance would be 174.00, followed by July 11, 2024, peak at 175.43. On further strength, the next resistance will be 176.00 and subsequently 177.00 and 178.00, the “ascending triangle’s objective.”
EUR/JPY Price Chart – Daily
Euro Price This week
The table below shows the percentage change of Euro (EUR) against listed major currencies this week. Euro was the strongest against the US Dollar.
| USD | EUR | GBP | JPY | CAD | AUD | NZD | CHF | |
|---|---|---|---|---|---|---|---|---|
| USD | -1.12% | -0.71% | -0.79% | -0.69% | -0.61% | -0.63% | -1.30% | |
| EUR | 1.12% | 0.44% | 0.28% | 0.44% | 0.56% | 0.46% | -0.18% | |
| GBP | 0.71% | -0.44% | -0.10% | 0.00% | 0.12% | 0.02% | -0.74% | |
| JPY | 0.79% | -0.28% | 0.10% | 0.08% | 0.23% | 0.15% | -0.50% | |
| CAD | 0.69% | -0.44% | 0.00% | -0.08% | 0.19% | 0.01% | -0.73% | |
| AUD | 0.61% | -0.56% | -0.12% | -0.23% | -0.19% | -0.10% | -0.78% | |
| NZD | 0.63% | -0.46% | -0.02% | -0.15% | -0.01% | 0.10% | -0.75% | |
| CHF | 1.30% | 0.18% | 0.74% | 0.50% | 0.73% | 0.78% | 0.75% |
The heat map shows percentage changes of major currencies against each other. The base currency is picked from the left column, while the quote currency is picked from the top row. For example, if you pick the Euro from the left column and move along the horizontal line to the US Dollar, the percentage change displayed in the box will represent EUR (base)/USD (quote).

Acuity Trading
Acuity Trading is a London-based fintech company founded in 2013 that specializes in AI-powered alternative data and sentiment analysis for trading and investments. They revolutionized the online trading experience by introducing visual news and sentiment tools, and today they continue to lead the fintech market with alpha-generating alternative data and highly engaging trading tools using the latest AI research and technology.
Read More


