


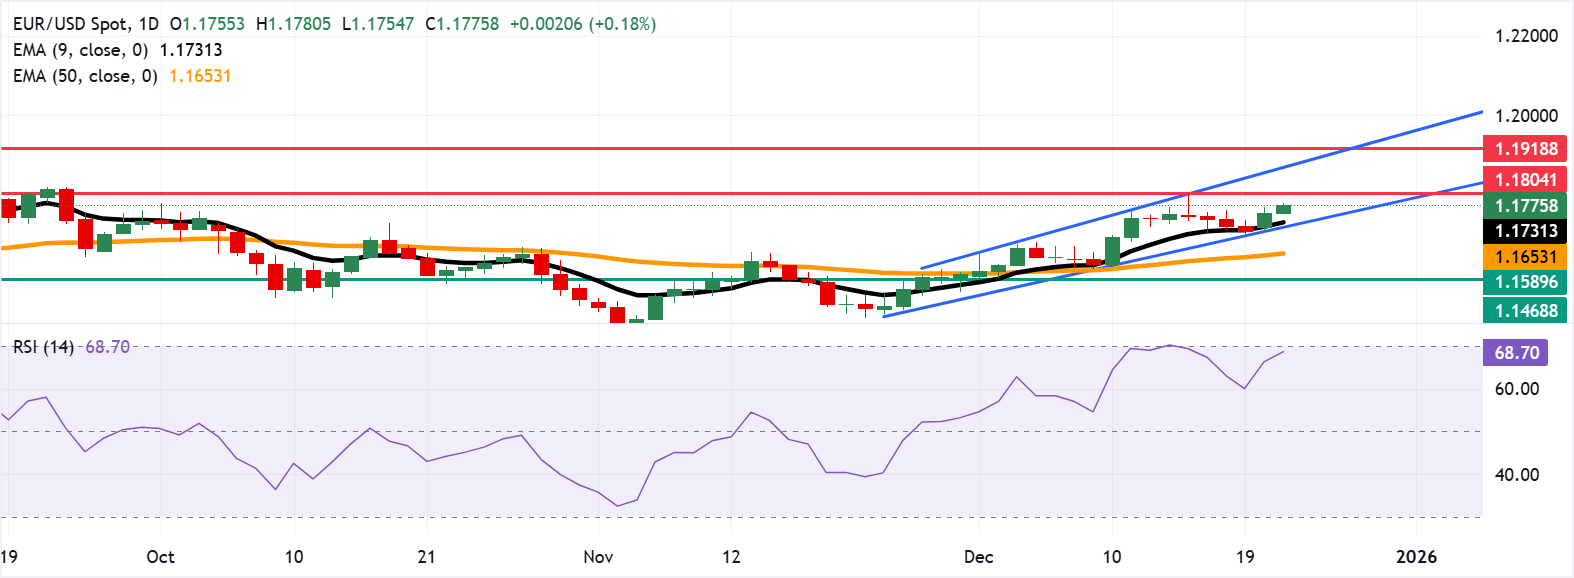
- EUR/USD could target the two-month high of 1.1804.
- The 14-day Relative Strength Index near 69 signals strong demand but risks capping gains if overbought conditions develop.
- The primary support appears at the nine-day EMA of 1.1731.
EUR/USD extends its gains for the second successive session, trading around 1.1780 during the Asian hours on Tuesday. On the daily chart, technical analysis indicates a persistent bullish bias, as the pair moves upward within the ascending channel pattern. Additionally, the 14-day Relative Strength Index (RSI) at 68.89 sits near overbought, signaling strong demand. RSI remains elevated, which could cap gains if overbought conditions emerge.
The EUR/USD pair holds above the nine-day Exponential Moving Average (EMA) and the 50-day EMA, maintaining a bullish bias. The shorter average leads the longer one, reinforcing upward momentum. The trend tone stays firm as the EMAs slope higher and price action respects the upside. The nine-day EMA continues to rise above the 50-day, keeping the near-term posture positive.
The EUR/USD pair eyes the psychological level of 1.1800, aligned with the two-month high of 1.1804, which was recorded on December 16. A break above this confluence resistance area would open the doors toward the upper boundary of the ascending channel around 1.1870, followed by 1.1918, the highest level since June 2021.
On the downside, the immediate support lies at the nine-day EMA of 1.1731, followed by the lower ascending channel boundary around 1.1720. A break below the channel would weaken the short-term price momentum and put downward pressure on the EUR/USD pair to test the 50-day EMA at 1.1653. Further declines would lead the pair to test the three-week low of 1.1589, which was recorded on December 1.
Euro Price Today
The table below shows the percentage change of Euro (EUR) against listed major currencies today. Euro was the strongest against the US Dollar.
| USD | EUR | GBP | JPY | CAD | AUD | NZD | CHF | |
|---|---|---|---|---|---|---|---|---|
| USD | -0.19% | -0.24% | -0.59% | -0.13% | -0.21% | -0.38% | -0.32% | |
| EUR | 0.19% | -0.05% | -0.39% | 0.07% | -0.03% | -0.19% | -0.13% | |
| GBP | 0.24% | 0.05% | -0.34% | 0.11% | 0.02% | -0.14% | -0.07% | |
| JPY | 0.59% | 0.39% | 0.34% | 0.46% | 0.39% | 0.19% | 0.29% | |
| CAD | 0.13% | -0.07% | -0.11% | -0.46% | -0.07% | -0.26% | -0.17% | |
| AUD | 0.21% | 0.03% | -0.02% | -0.39% | 0.07% | -0.16% | -0.10% | |
| NZD | 0.38% | 0.19% | 0.14% | -0.19% | 0.26% | 0.16% | 0.06% | |
| CHF | 0.32% | 0.13% | 0.07% | -0.29% | 0.17% | 0.10% | -0.06% |
The heat map shows percentage changes of major currencies against each other. The base currency is picked from the left column, while the quote currency is picked from the top row. For example, if you pick the Euro from the left column and move along the horizontal line to the US Dollar, the percentage change displayed in the box will represent EUR (base)/USD (quote).
(The technical analysis of this story was written with the help of an AI tool.)


