


- EUR/USD consolidates near 1.1600 as the US Dollar holds firm in a quiet market.
- Monetary policy divergence supports a bullish tilt as ECB is expected to hold rates on December 18, while the Fed is seen cutting next week.
- Technical setup remains constructive, with EUR/USD holding above the 21-day SMA while the 100-day SMA limits upside.
The Euro (EUR) trades flat against the US Dollar (USD) on Tuesday, pressured by a steady Greenback in an otherwise calm market. At the time of writing, EUR/USD is trading around 1.1607, pausing a six-day winning streak after briefly rising to over two-week highs on Monday.
With no major US data released on Tuesday, price action remained subdued as traders showed a muted reaction to the preliminary Eurozone inflation numbers. The latest figures showed that Harmonized Index of Consumer Prices rose 2.2% YoY in November, above the 2.1% recorded in October, while Core HICP increased 2.4% YoY, unchanged from the previous month.
Monetary policy divergence continues to shape the broader outlook. The path of least resistance appears tilted to the upside, with the European Central Bank (ECB) widely expected to keep interest rates unchanged at its December 18 meeting. In contrast, US markets remain convinced that the Federal Reserve (Fed) will lower rates at next week’s monetary policy meeting.
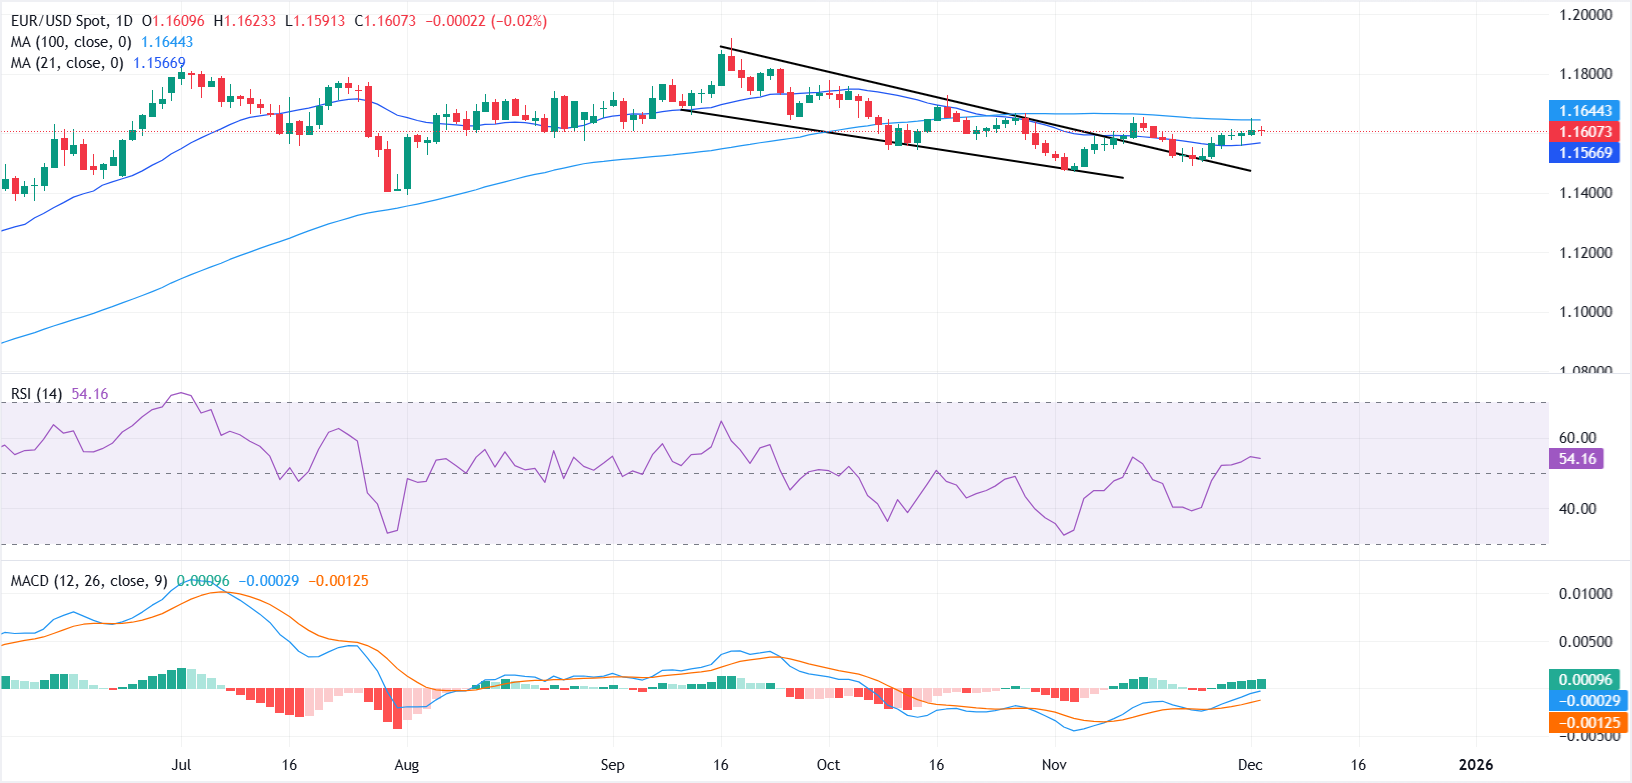
From a technical perspective, EUR/USD remains constructive following its breakout and retest of the falling-wedge pattern, with prices consolidating before a potential next leg higher.
The 100-day Simple Moving Average (SMA) continues to cap the immediate upside, while the 21-day SMA is acting as dynamic support. A clear break above the 100-day SMA is needed to confirm bullish continuation, with the next resistance level located near 1.1700.
On the downside, a drop below the 21-day SMA would keep the near-term outlook subdued to slightly bearish. Momentum indicators support the ongoing consolidation phase but suggest bulls are gradually gaining control.
The Relative Strength Index (RSI) has climbed back above 50, while the Moving Average Convergence Divergence (MACD) has turned positive near the zero line, with green histogram bars hinting at a tentative momentum pickup.
Looking ahead, key economic releases later this week from both sides of the Atlantic could provide fresh impetus for EUR/USD. In the Eurozone, traders will monitor Wednesday’s Producer Price Index (PPI) and HCOB Composite Purchasing Managers Index (PMI), followed by Retail Sales on Thursday and the Employment Change (QoQ) and final Q3 Gross Domestic Product (GDP) figures on Friday.
In the United States, Wednesday’s ADP Employment Change and ISM Services PMI will be in focus, while Friday’s Personal Consumption Expenditures (PCE) data will be closely watched for further clues on the Fed’s monetary policy outlook.
US Dollar Price Today
The table below shows the percentage change of US Dollar (USD) against listed major currencies today. US Dollar was the strongest against the Japanese Yen.
| USD | EUR | GBP | JPY | CAD | AUD | NZD | CHF | |
|---|---|---|---|---|---|---|---|---|
| USD | 0.02% | 0.14% | 0.33% | -0.11% | -0.25% | -0.05% | -0.10% | |
| EUR | -0.02% | 0.13% | 0.31% | -0.13% | -0.27% | -0.07% | -0.12% | |
| GBP | -0.14% | -0.13% | 0.16% | -0.26% | -0.41% | -0.20% | -0.24% | |
| JPY | -0.33% | -0.31% | -0.16% | -0.43% | -0.57% | -0.38% | -0.42% | |
| CAD | 0.11% | 0.13% | 0.26% | 0.43% | -0.13% | 0.05% | 0.01% | |
| AUD | 0.25% | 0.27% | 0.41% | 0.57% | 0.13% | 0.19% | 0.15% | |
| NZD | 0.05% | 0.07% | 0.20% | 0.38% | -0.05% | -0.19% | -0.04% | |
| CHF | 0.10% | 0.12% | 0.24% | 0.42% | -0.01% | -0.15% | 0.04% |
The heat map shows percentage changes of major currencies against each other. The base currency is picked from the left column, while the quote currency is picked from the top row. For example, if you pick the US Dollar from the left column and move along the horizontal line to the Japanese Yen, the percentage change displayed in the box will represent USD (base)/JPY (quote).


