
Trade The World
Polkadot Price Forecast: DOT eyes 35% triangle breakout as network caps supply
By John Isige
Date Published: 15 Sep 2025 | Date Modified: 15 Sep 2025


POPULAR ARTICLES

Polkadot (DOT) is retreating from last week’s highs, trading at $4.20 on Monday. The pullback reflects an overall downturn in prices on Monday, as investors focus on the likelihood of an interest rate cut by the United States (US) Federal Reserve (Fed) on Wednesday.
- Polkadot faces short-term selling pressure as a bearish wave sweeps through the crypto market on Monday.
- The Polkadot community passes a resolution capping the maximum supply at 2.1 billion DOT.
- Capping the maximum supply could boost DOT’s bullish potential if demand increases.
Polkadot (DOT) is retreating from last week’s highs, trading at $4.20 on Monday. The pullback reflects an overall downturn in prices on Monday, as investors focus on the likelihood of an interest rate cut by the United States (US) Federal Reserve (Fed) on Wednesday.
Despite the short-term bearish outlook, Polkadot has displayed robust bullish potential, backed by a resolution that has capped the protocol’s maximum supply and an ascending triangle pattern in the daily time frame.
Polkadot’s new supply model
The Polkadot community has passed Resolution 1710, with 81% of votes in favor of introducing a "hard cap" on the network’s maximum supply at 2.1 billion. This results in a reduction in annual emissions, supporting key narratives of scarcity and predictability for the native token, DOT.
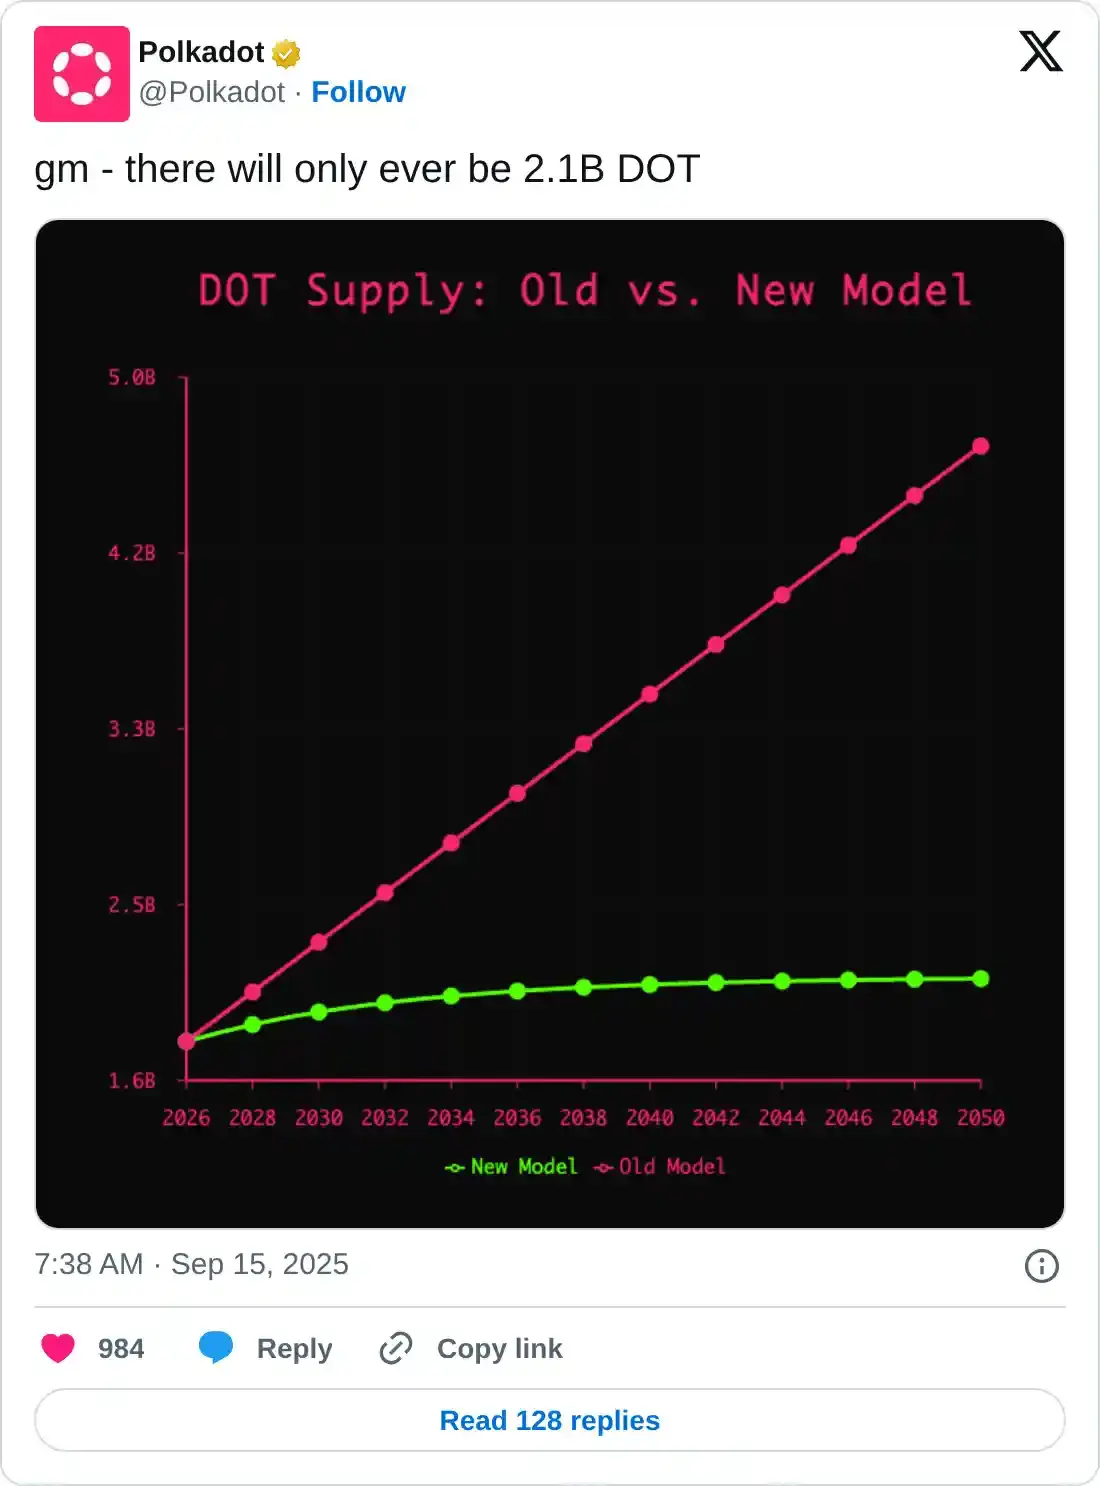
Previously, Polkadot had an infinite supply model, with the current total supply averaging at 1.522 billion DOT. With the new model, Polkadot’s maximum supply won’t exceed 2.1 billion DOT, with new issuance reducing every two years on March 14 (Pi Day).
The network expects to have achieved a total supply of approximately 1.91 billion DOT compared to 3.4 billion DOT under the previous supply model.
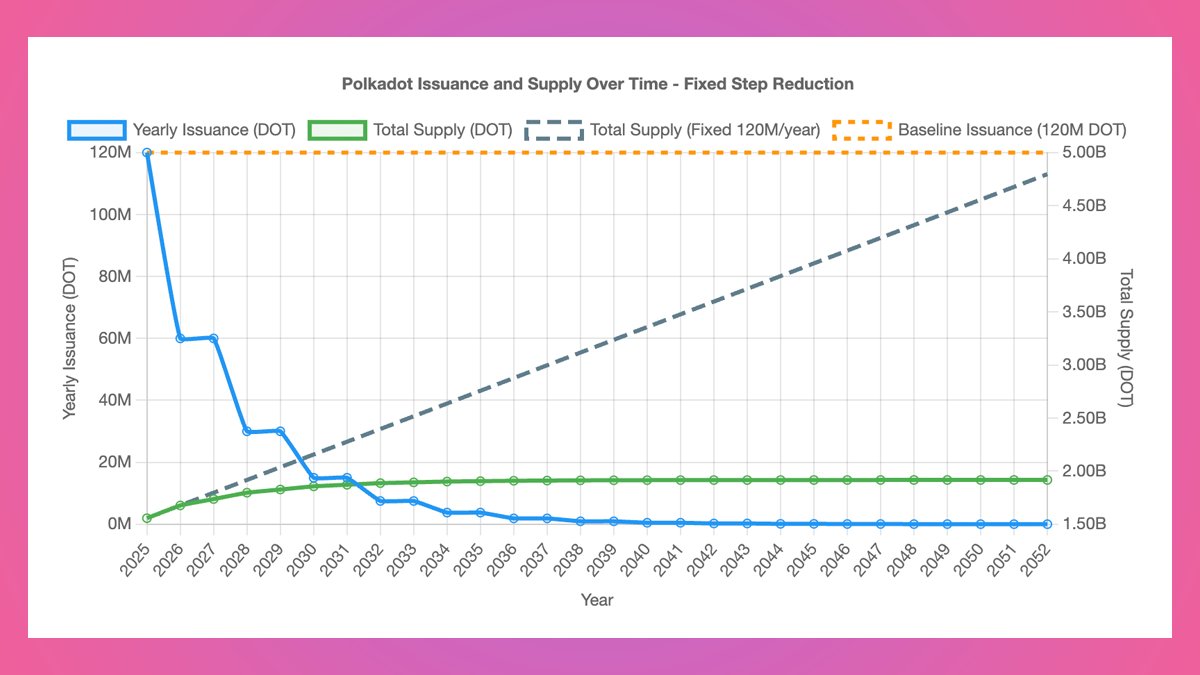
Polkadot issuance and supply over time | Source: Polkadot
The demand for Polkadot remains elevated based on the futures Open Interest (OI), which currently stands at approximately $594 million, having peaked at $634 million on Sunday. The pullback in OI, referring to the notional value of outstanding futures contracts, reflects the intraday decline in the price of DOT from $4.62 to its current level of $4.20. This correction could persist in the short term if investors continue de-risking, but Polkadot displays medium-term bullish potential.
Technical outlook: Can Polkadot hold key support ahead of breakout?
Polkadot holds below the 200-day Exponential Moving Average (EMA) at $4.26 at the time of writing on Monday, following a correction from the past week’s high of $4.62.
A sharp decline in the Relative Strength Index (RSI) to 54 on the daily chart highlights easing bullish momentum. If the RSI extends the correction below the midline, the path of least resistance could remain downward toward a confluence support established by the 50-day and 100-day EMA around $4.00.
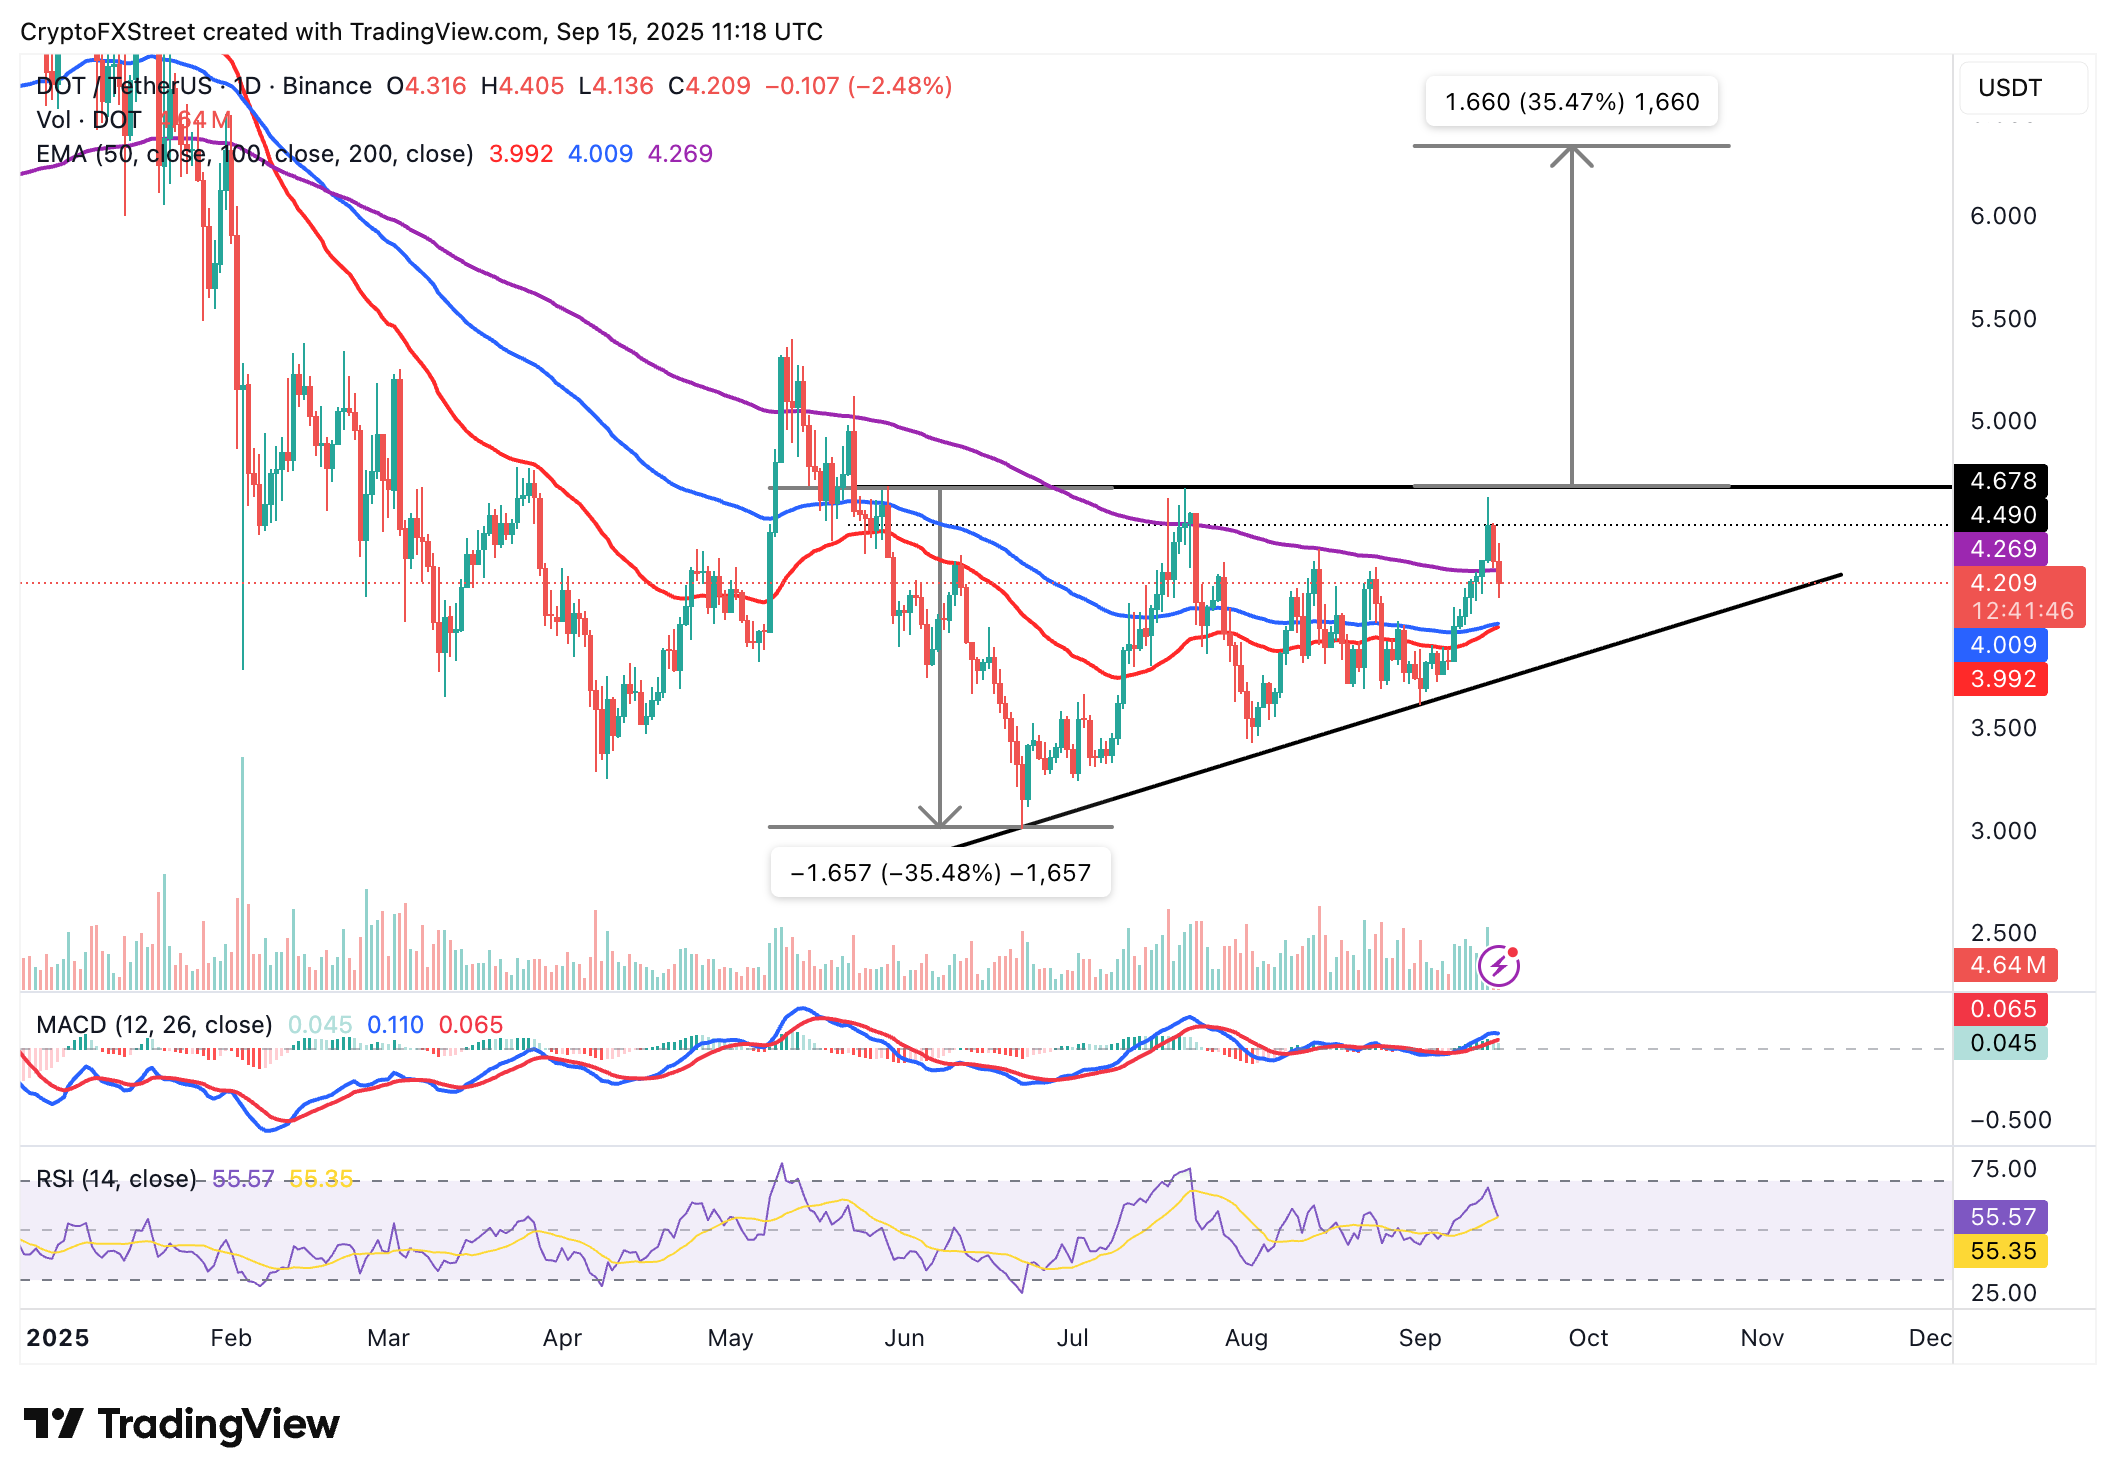
DOT/USDT daily chart
However, an upturn in the RSI toward overbought territory would confirm Polkadot’s bullish potential for an ascending triangle breakout. The daily chart above highlights the formation of an ascending triangle, highlighting an ongoing consolidation period ahead of a potential 35% move to $6.34.
Traders will look out for a potential break above the resistance level at $4.67 before committing fully to Polkadot. The breakout length is determined by the height of the triangle pattern, extrapolated above the $4.67 level.
Another key bullish signal would be the 50-day EMA completing the breakout above the 100-day EMA and forming a Golden Cross pattern. This bullish formation occurs when a shorter-term moving average crosses above a longer-term moving average, underscoring the bullish sentiment that market.
Open Interest, funding rate FAQs
Higher Open Interest is associated with higher liquidity and new capital inflow to the market. This is considered the equivalent of increase in efficiency and the ongoing trend continues. When Open Interest decreases, it is considered a sign of liquidation in the market, investors are leaving and the overall demand for an asset is on a decline, fueling a bearish sentiment among investors.
Funding fees bridge the difference between spot prices and prices of futures contracts of an asset by increasing liquidation risks faced by traders. A consistently high and positive funding rate implies there is a bullish sentiment among market participants and there is an expectation of a price hike. A consistently negative funding rate for an asset implies a bearish sentiment, indicating that traders expect the cryptocurrency’s price to fall and a bearish trend reversal is likely to occur.

Acuity Trading
Acuity Trading is a London-based fintech company founded in 2013 that specializes in AI-powered alternative data and sentiment analysis for trading and investments. They revolutionized the online trading experience by introducing visual news and sentiment tools, and today they continue to lead the fintech market with alpha-generating alternative data and highly engaging trading tools using the latest AI research and technology.
Read More


