
Trade The World
XRP price at risk of extending sell-off below $3.00 amid neutral retail activity
By John Isige
Date Published: 15 Aug 2025 | Date Modified: 15 Aug 2025


POPULAR ARTICLES

Ripple (XRP) leans slightly bearish, holding above support at $3.00 on Friday.
- XRP price holds above $3.00 as investors digest the impact of US PPI data on inflation and the Fed's interest rate decision.
- Declining futures Open Interest indicates waning bullish momentum and reduced investor interest.
- XRP's neutral retail activity signals upward potential without overheating.
Ripple (XRP) leans slightly bearish, holding above support at $3.00 on Friday. The cross-border remittance token abandoned the push toward its record high of $3.66 earlier in the week, peaking at $3.35 on Thursday before trimming gains amid fresh concerns about inflation rising in the United States (US).
Investors in risk assets like crypto are concerned that hotter-than-expected Producer Price Index (PPI) data could drive inflation higher – a move likely to cause the Federal Reserve (Fed) to hesitate about implementing the highly anticipated rate cut in September.
XRP faces declining open interest and neutral retail activity
XRP's derivatives market showcases weakness, characterized by the futures Open Interest (OI) falling below $8 billion after peaking near $9 billion on Thursday. The current XRP OI level stands significantly below the $10.94 billion seen on July 22 after XRP hit a new all-time high on July 18.
A persistent decrease in OI indicates that XRP is dealing with low risk-on sentiment as fewer traders bet on the price rising in the short term. If this trend holds, recovery toward the $3.66 all-time high might be a pipe dream in the near term.
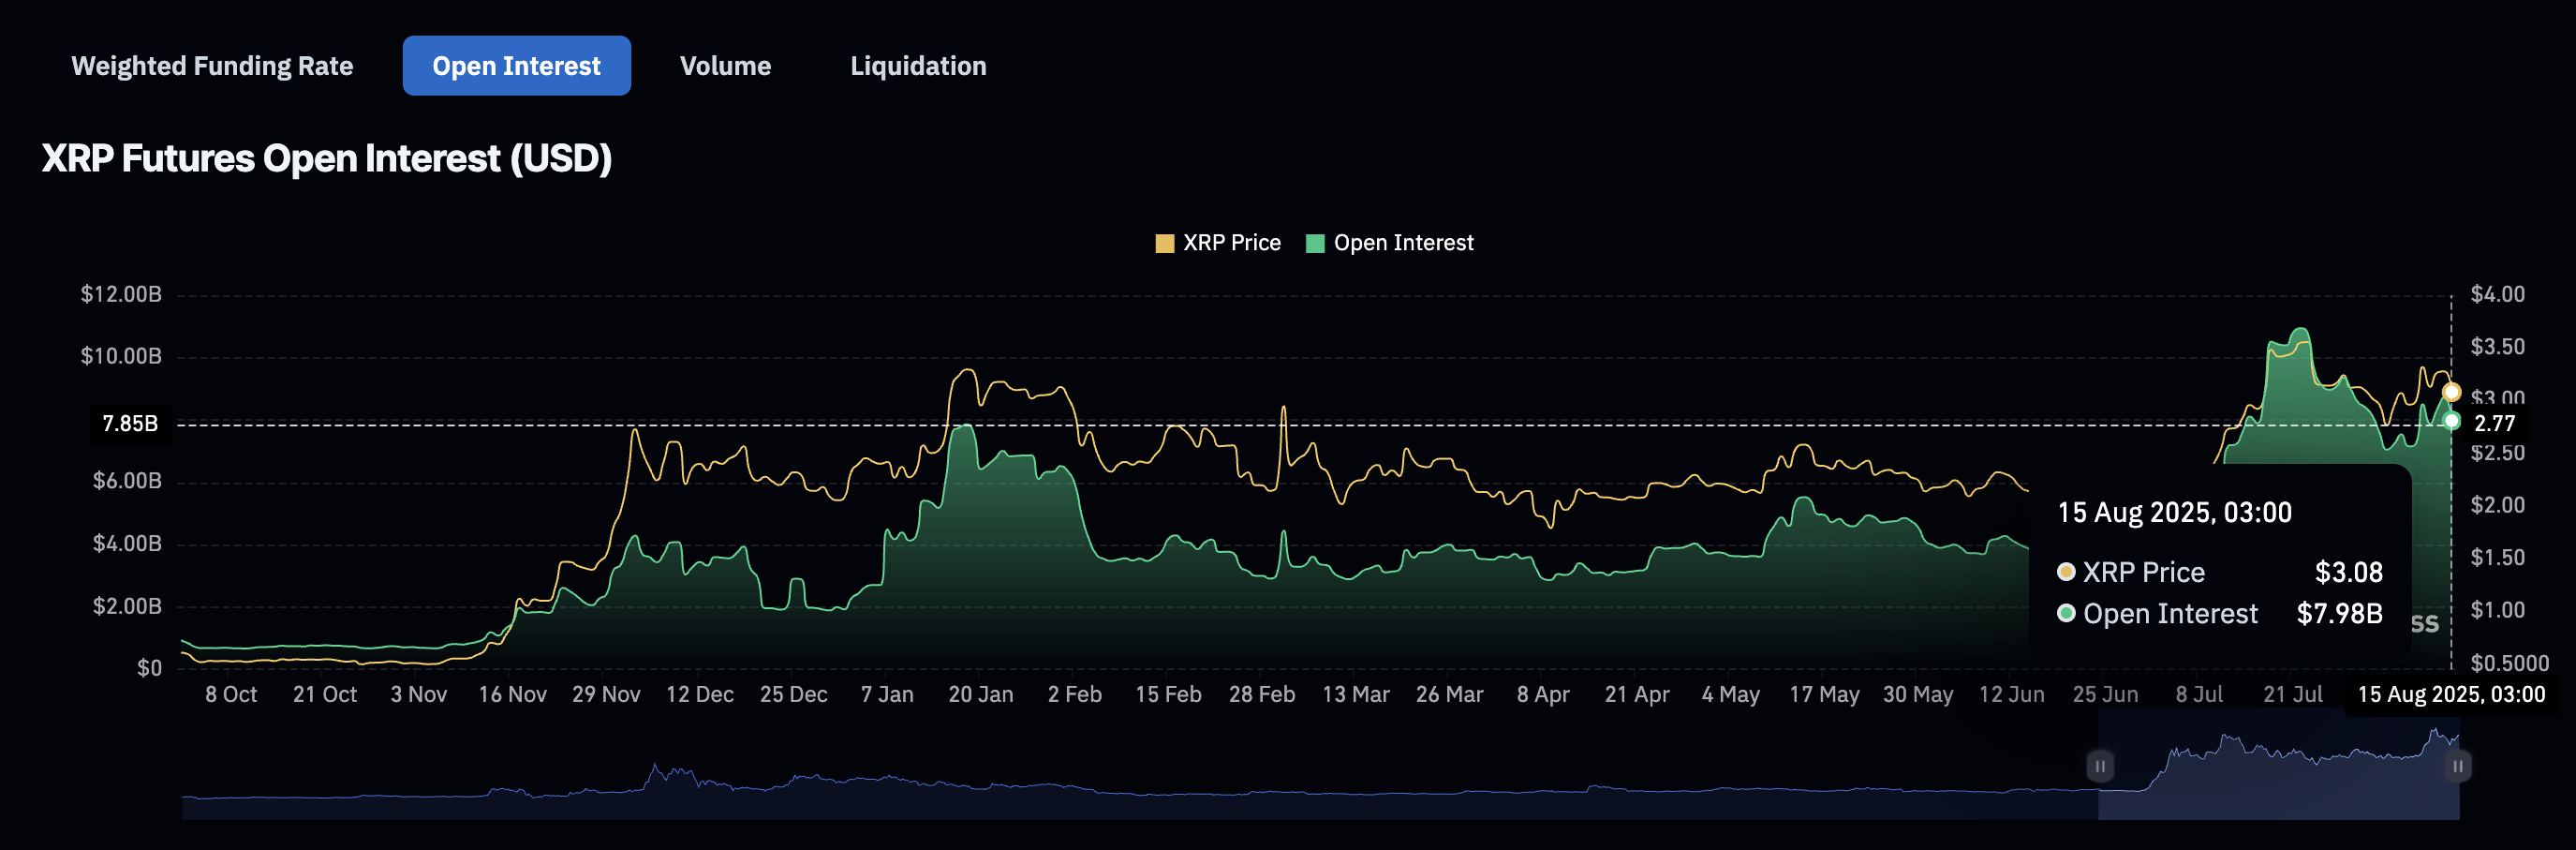
XRP futures Open Interest | Source: CoinGlass
Still, the XRP Ledger's Futures Retail Activity Through Trading Frequency Surge metric by CryptoQuant suggests that there's still room for more upside movement in the short term.
Historically, red-coloured bubbles as seen on the chart below highlight periods when the futures retail market for XRP is overheating.
The last time this occurred was from early December to January, when XRP surged to a high of $3.40, marking a local peak. Currently, the metric is in the neutral zone, signaling that there's still potential for upward movement in XRP price without signs of overheating.
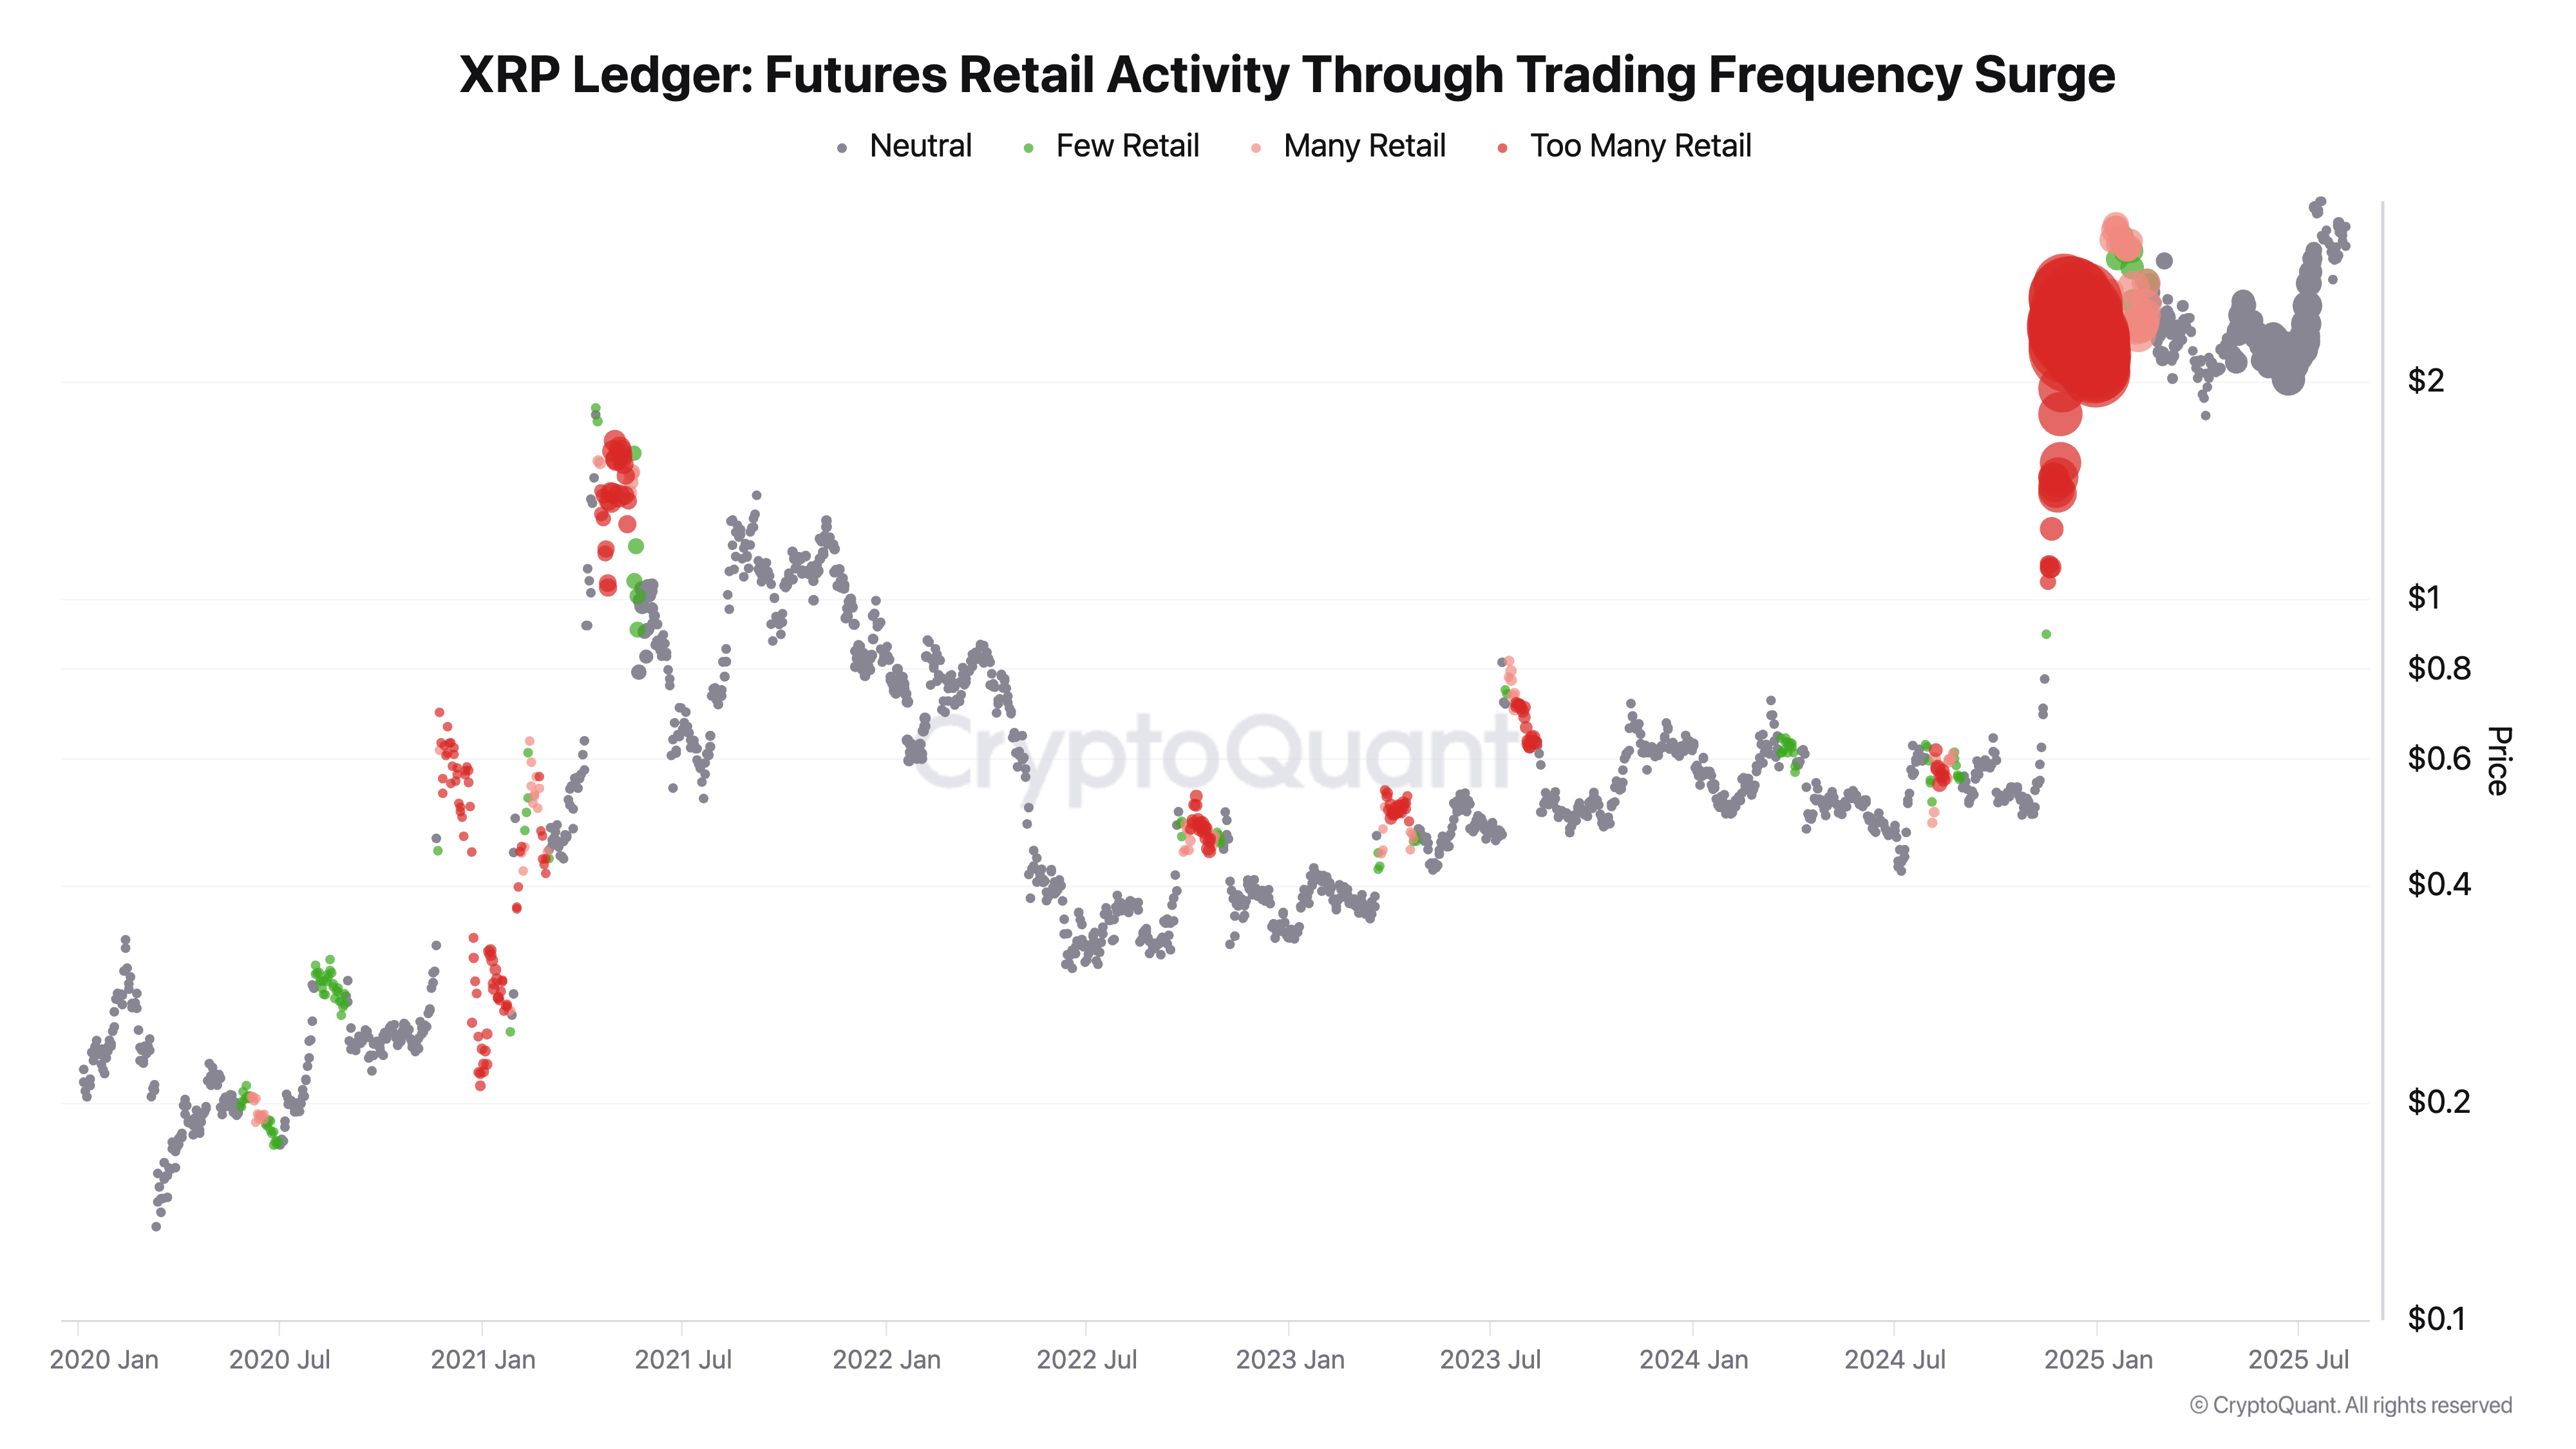
XRP Ledger's Futures Retail Activity Through Trading Frequency Surge | Source: CryptoQuant
Technical outlook: XRP risks extending correction below $3.00
XRP price is testing support at $3.00 amid bearish shockwaves in the broader cryptocurrency market. The Relative Strength Index (RSI), which is declining toward oversold territory on the 4-hour chart, indicates reduced buying pressure
A sell signal maintained by the Moving Average Convergence Divergence (MACD) indicator since Thursday backs the ongoing trend correction. XRP will likely prolong the reversal below the $3.00 demand area if the blue MACD line remains below the red signal line.
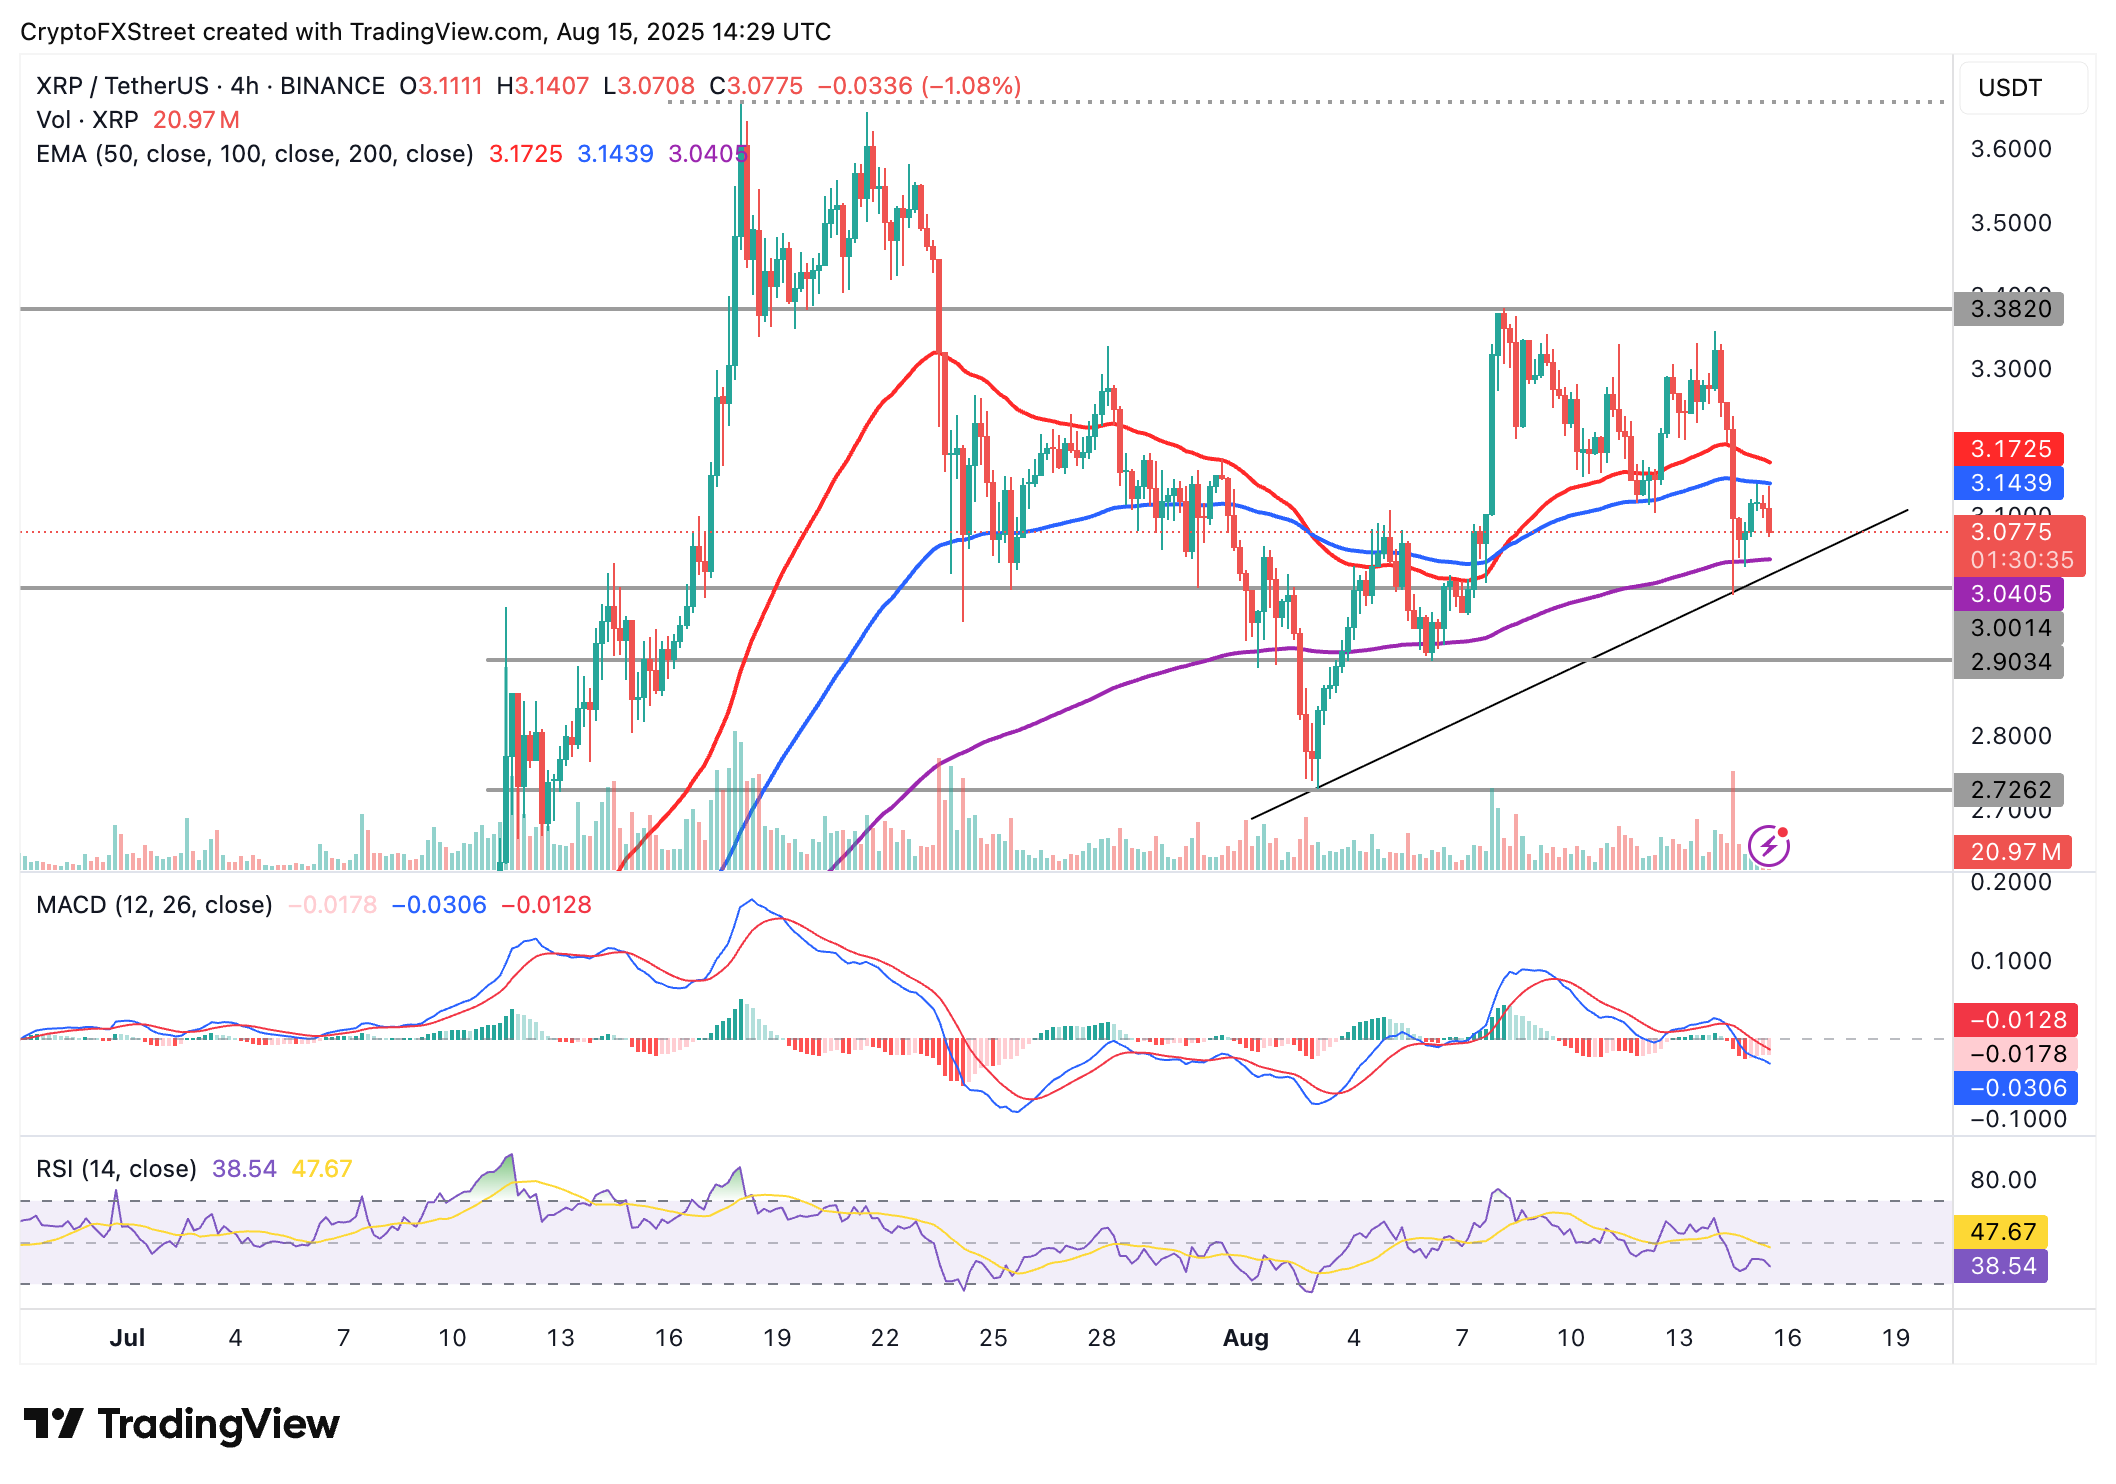
XRP/USDT 4-hour chart
The 200-period Exponential Moving Average (EMA) at $3.04 could absorb the selling pressure. Still, if the decline accelerates, traders will shift their attention to the next tentative support levels at $2.90, tested on August 6 and at $2.72, also tested on August 3.
Open Interest, funding rate FAQs
Higher Open Interest is associated with higher liquidity and new capital inflow to the market. This is considered the equivalent of increase in efficiency and the ongoing trend continues. When Open Interest decreases, it is considered a sign of liquidation in the market, investors are leaving and the overall demand for an asset is on a decline, fueling a bearish sentiment among investors.
Funding fees bridge the difference between spot prices and prices of futures contracts of an asset by increasing liquidation risks faced by traders. A consistently high and positive funding rate implies there is a bullish sentiment among market participants and there is an expectation of a price hike. A consistently negative funding rate for an asset implies a bearish sentiment, indicating that traders expect the cryptocurrency’s price to fall and a bearish trend reversal is likely to occur.

Acuity Trading
Acuity Trading is a London-based fintech company founded in 2013 that specializes in AI-powered alternative data and sentiment analysis for trading and investments. They revolutionized the online trading experience by introducing visual news and sentiment tools, and today they continue to lead the fintech market with alpha-generating alternative data and highly engaging trading tools using the latest AI research and technology.
Read More


