
Trade The World
USD/CAD Price Forecast: Hovers around 1.3950, lower boundary of ascending channel
By Akhtar Faruqui
Date Published: 6 Oct 2025 | Date Modified: 6 Oct 2025


POPULAR ARTICLES

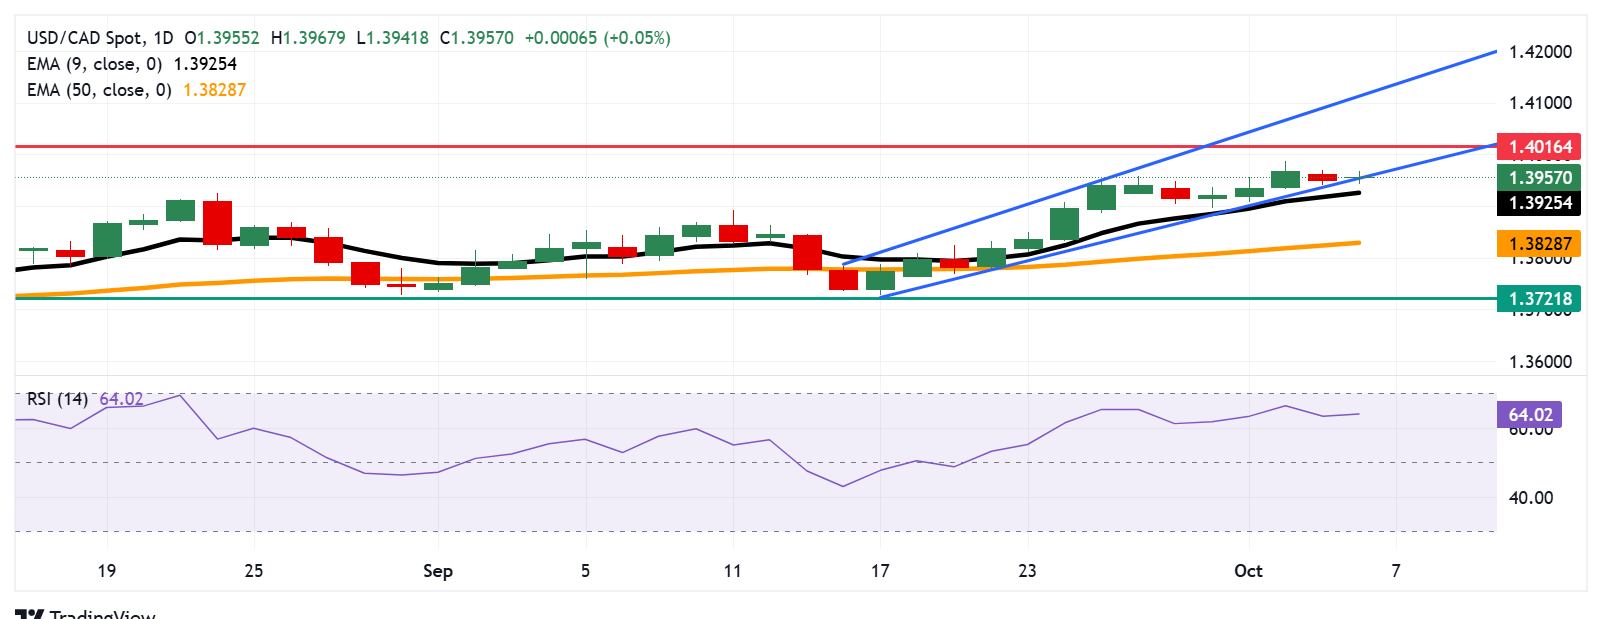
USD/CAD remains subdued for the second successive session, trading around 1.3950 during the European hours on Monday. The technical analysis of the daily chart suggests the weakening of the bullish bias as the pair is attempting to break below the ascending channel pattern.
- USD/CAD may target its initial barrier at the six-month high of 1.4016.
- The 14-day Relative Strength Index remains above the 50 mark, indicating that the bullish bias persists.
- The initial support lies at the nine-day EMA of 1.3828.
USD/CAD remains subdued for the second successive session, trading around 1.3950 during the European hours on Monday. The technical analysis of the daily chart suggests the weakening of the bullish bias as the pair is attempting to break below the ascending channel pattern.
The 14-day Relative Strength Index (RSI) stays above the 50 level, suggesting that bullish bias is still active. Additionally, the USD/CAD pair remains above the nine-day Exponential Moving Average (EMA), indicating the short-term price momentum is stronger.
If the USD/CAD pair rebounds within the ascending channel, it may target its primary barrier at the six-month high of 1.4016, which was reached on May 13. A break above this level would lead the pair to test the upper boundary of the ascending channel around 1.4110.
On the downside, the USD/CAD pair may find its initial support at the nine-day EMA of 1.3925. A break below this level would dampen the short-term price momentum and put downward pressure on the pair to navigate the region around the 50-day EMA at 1.3828.
USD/CAD: Daily Chart
Canadian Dollar Price Today
The table below shows the percentage change of Canadian Dollar (CAD) against listed major currencies today. Canadian Dollar was the strongest against the Euro.
| USD | EUR | GBP | JPY | CAD | AUD | NZD | CHF | |
|---|---|---|---|---|---|---|---|---|
| USD | 0.59% | 0.16% | 0.48% | -0.00% | -0.23% | -0.09% | 0.36% | |
| EUR | -0.59% | -0.53% | -0.19% | -0.62% | -0.86% | -0.71% | -0.26% | |
| GBP | -0.16% | 0.53% | 0.44% | -0.10% | -0.33% | -0.18% | 0.27% | |
| JPY | -0.48% | 0.19% | -0.44% | -0.42% | -0.75% | -0.62% | -0.15% | |
| CAD | 0.00% | 0.62% | 0.10% | 0.42% | -0.19% | -0.08% | 0.37% | |
| AUD | 0.23% | 0.86% | 0.33% | 0.75% | 0.19% | 0.15% | 0.59% | |
| NZD | 0.09% | 0.71% | 0.18% | 0.62% | 0.08% | -0.15% | 0.45% | |
| CHF | -0.36% | 0.26% | -0.27% | 0.15% | -0.37% | -0.59% | -0.45% |
The heat map shows percentage changes of major currencies against each other. The base currency is picked from the left column, while the quote currency is picked from the top row. For example, if you pick the Canadian Dollar from the left column and move along the horizontal line to the US Dollar, the percentage change displayed in the box will represent CAD (base)/USD (quote).

Acuity Trading
Acuity Trading is a London-based fintech company founded in 2013 that specializes in AI-powered alternative data and sentiment analysis for trading and investments. They revolutionized the online trading experience by introducing visual news and sentiment tools, and today they continue to lead the fintech market with alpha-generating alternative data and highly engaging trading tools using the latest AI research and technology.
Read More


