


- XRP extends its decline below the critical $2.00 level amid heightened volatility, exacerbating risk-off sentiment.
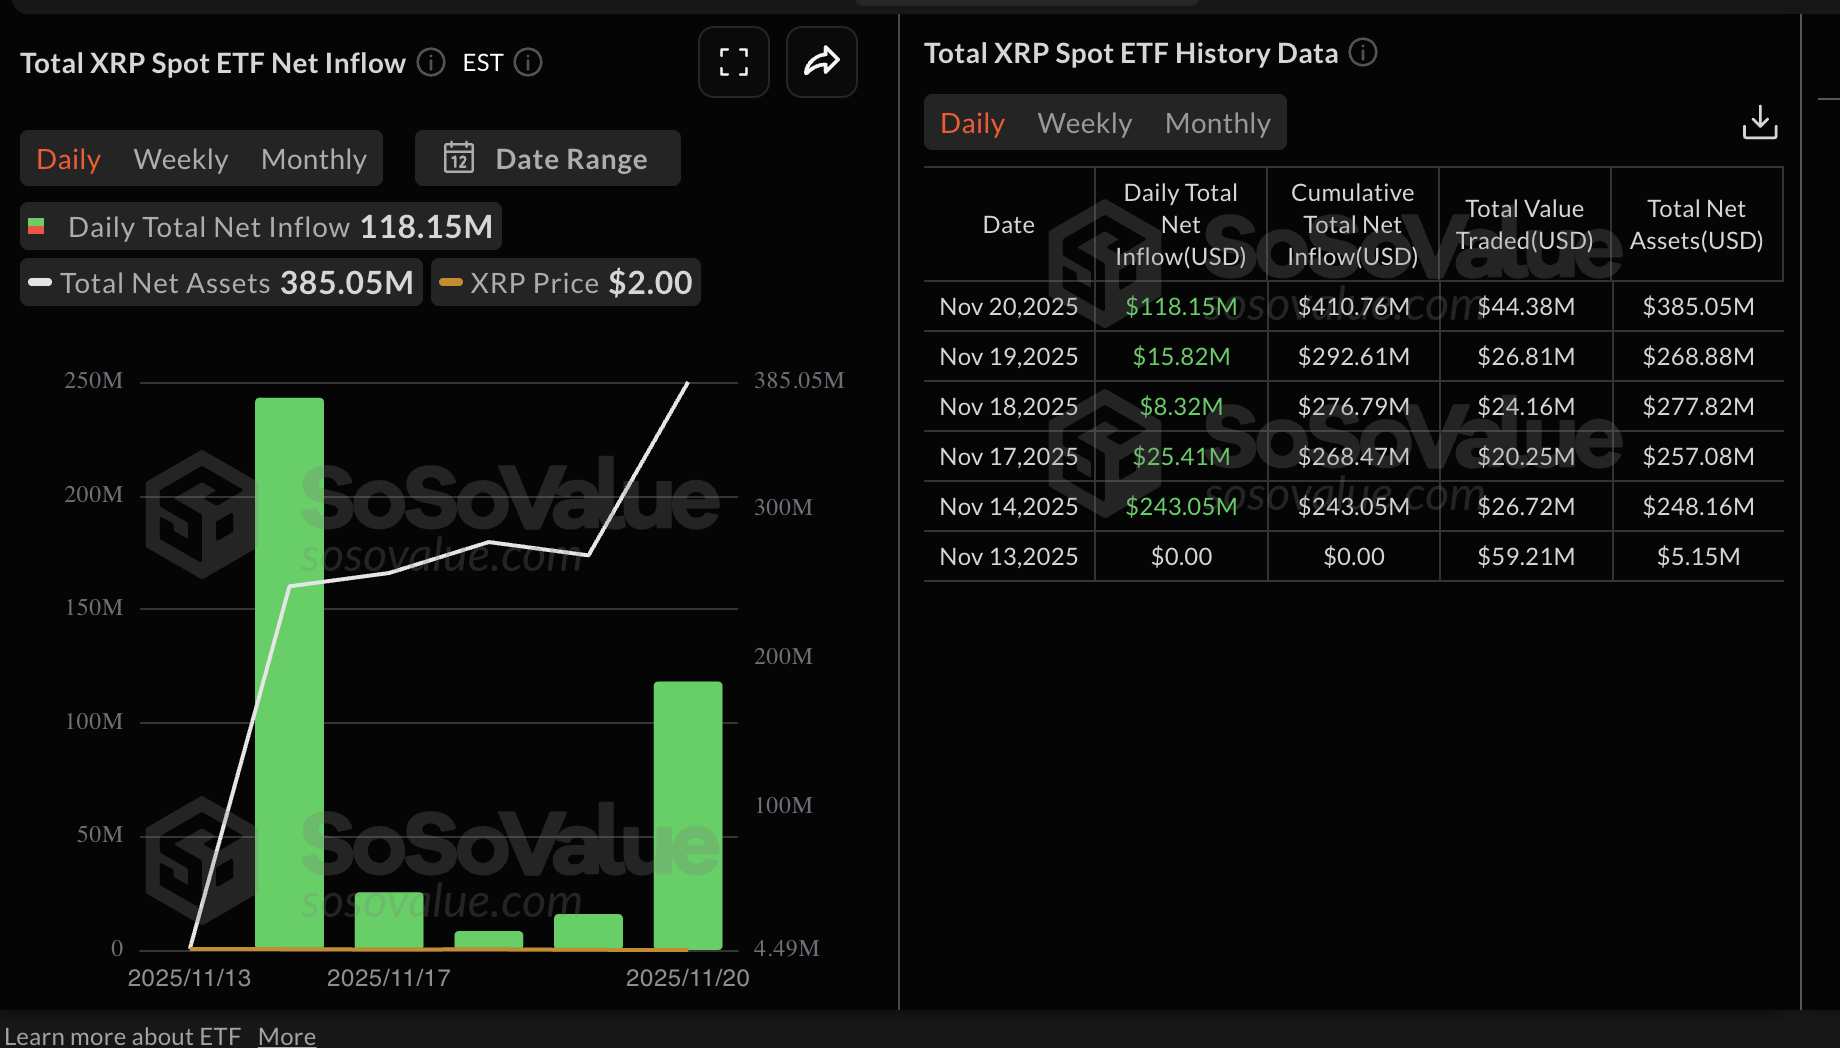
- Bitwise XRP ETF debuts, boosting net inflows to $118 million on Thursday.
- Low retail demand, as evidenced by a weak derivatives market, may cap attempts at recovery.
Ripple (XRP) is extending its down leg below $2.00, trading at $1.87 at the time of writing on Friday. Heightened volatility and macroeconomic uncertainty are supporting the sticky risk-off sentiment in the broader cryptocurrency market.
Since the October 10 flash crash that liquidated over $19 billion in crypto assets in a single day, the cross-border remittance token’s retail demand has not picked up, suggesting a deteriorating market structure.
XRP slides despite ETF inflows
Bitwise XRP ETF started trading on Thursday on the New York Stock Exchange (NYSE), giving United States (US) investors regulated access to the underlying asset (XRP) without directly buying or storing the token themselves. Bitwise’s XRP ETF recorded approximately $105 million in inflow volume on Thursday.
Combined, the Canary Capital XRPC and Bitwise XRP ETFs recorded $118 million in net inflow volume. SoSoValue data shows a cumulative net inflow of $411 million, with net assets of $385 million.
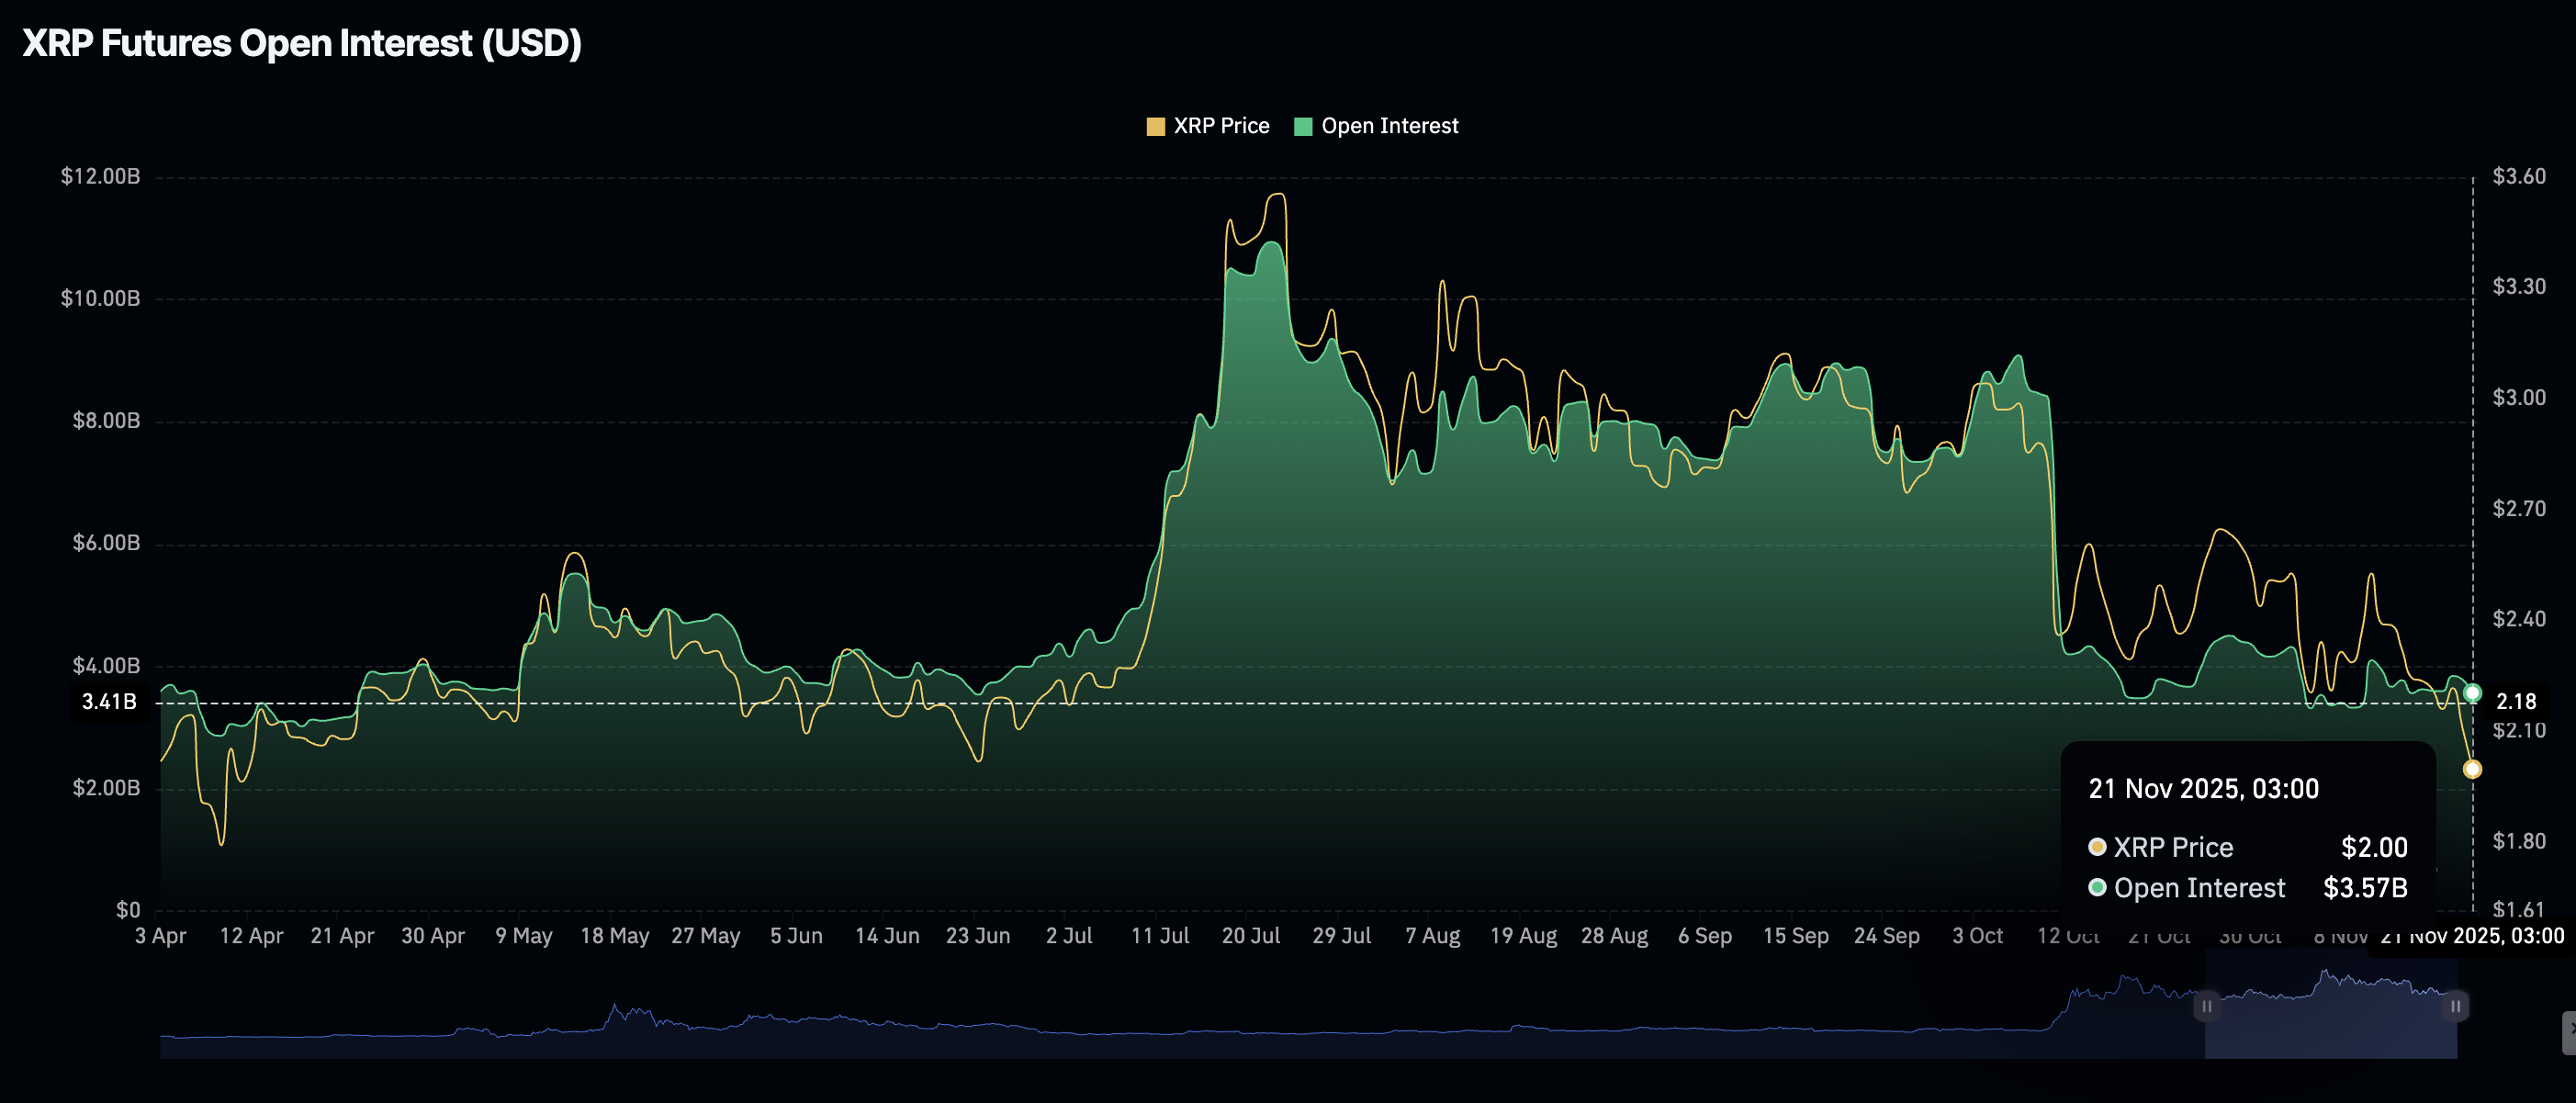
The XRP derivatives market has extended its weakness since mid-October, with futures Open Interest (OI) falling to $3.57 billion on Friday, down from $3.79 billion the previous day.
In comparison, OI, representing the notional value of outstanding futures contracts, stood at $8.36 billion on October 10 and $10.94 billion on July 22. This is a significant drop in retail demand, depriving XRP of the tailwind it needs to sustain a short-term recovery.
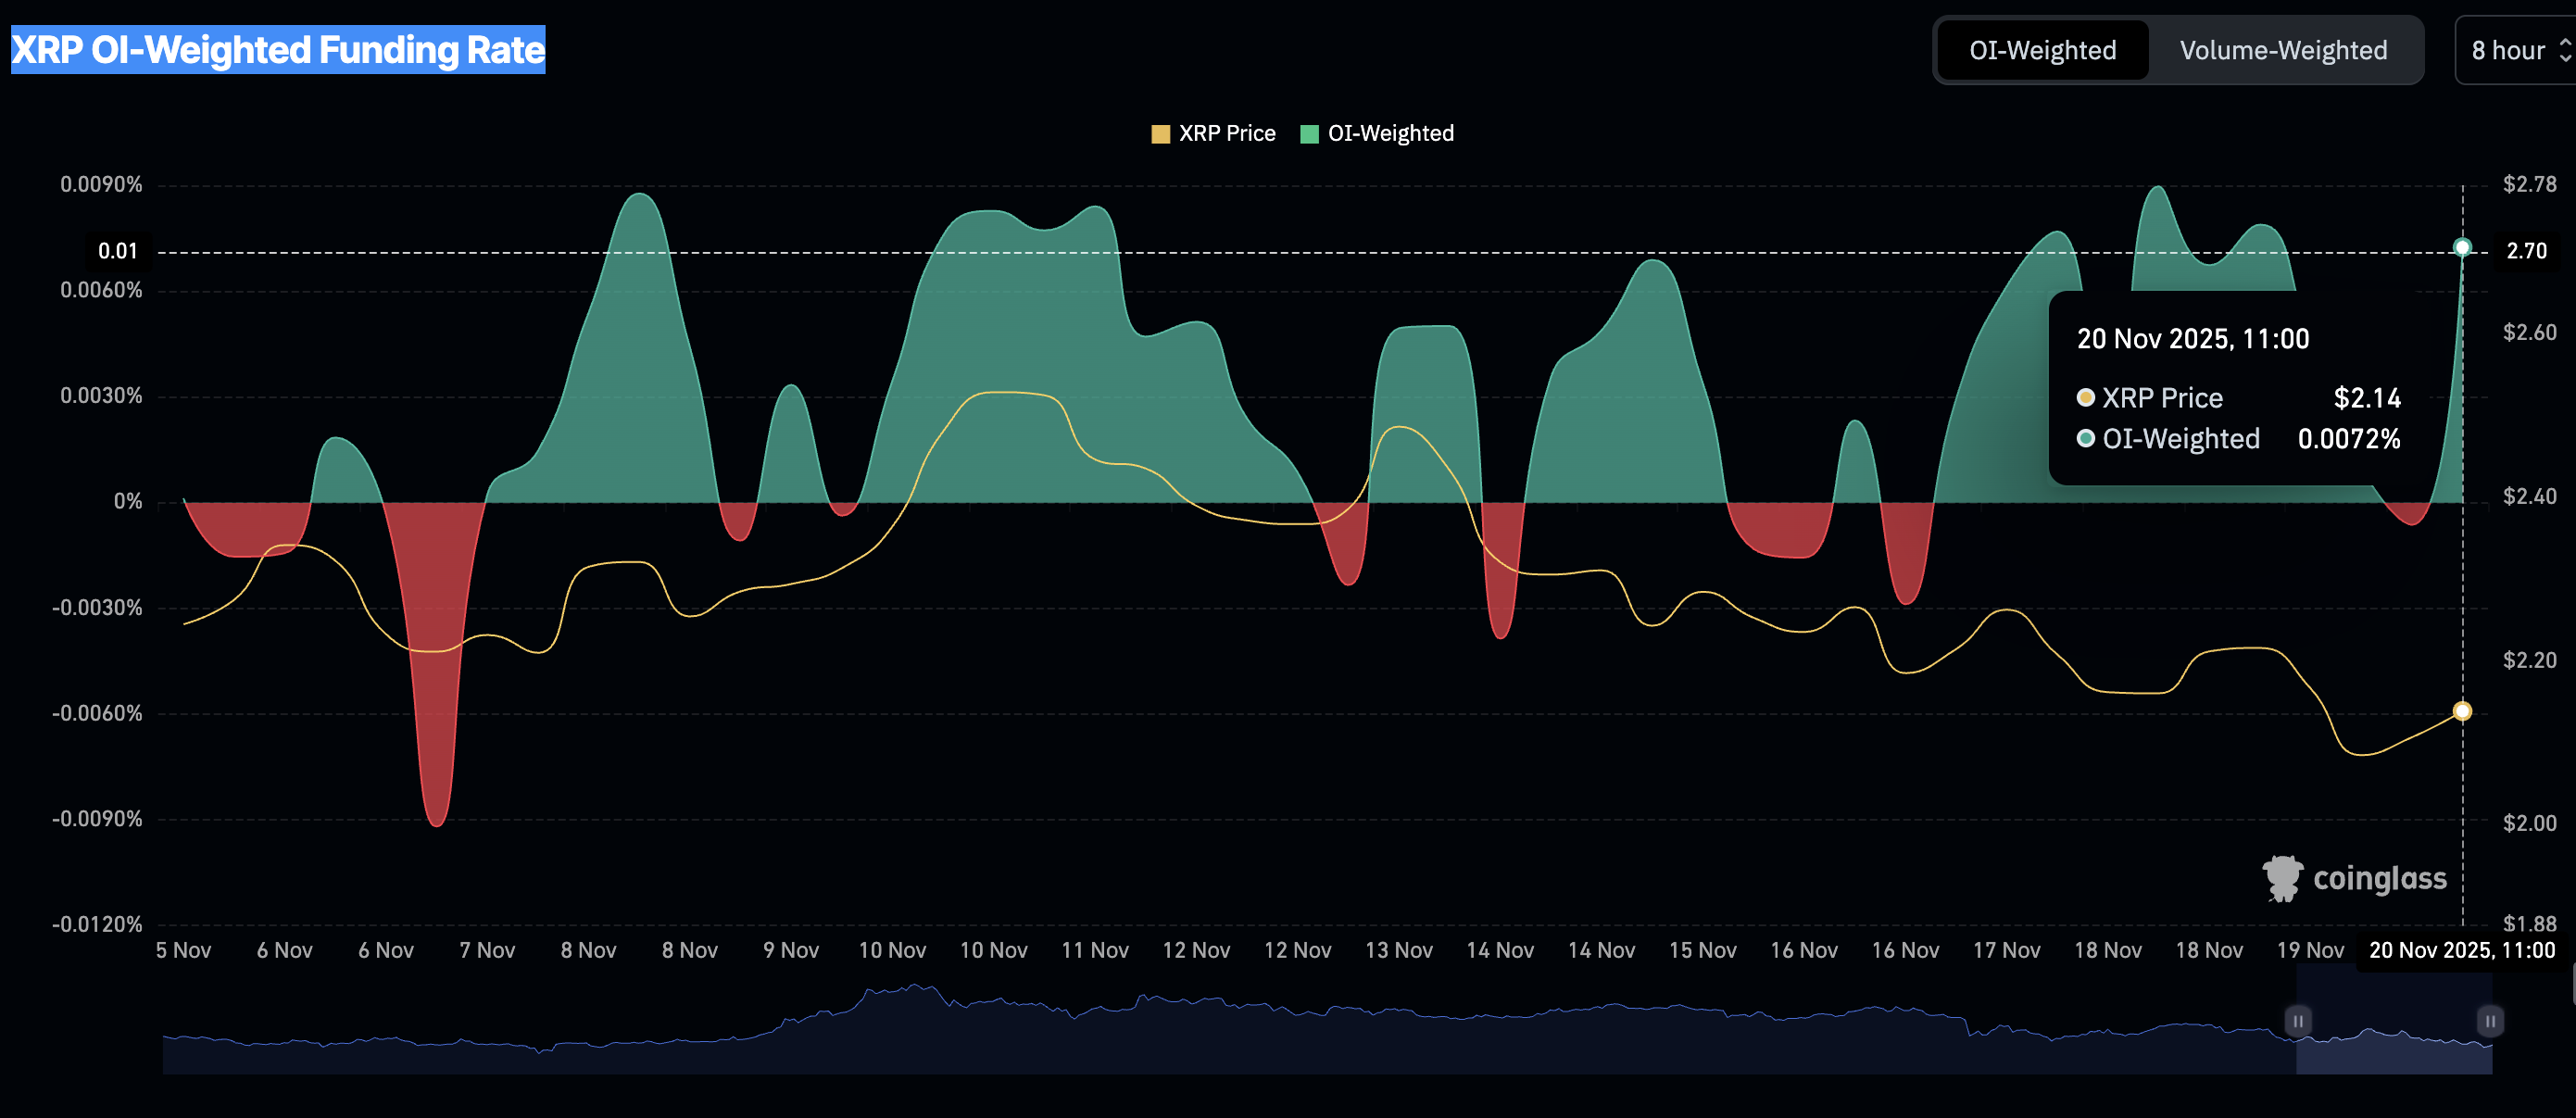
Despite the general bearish trend, traders show a desire to increase exposure by buying the deep. The XRP OI-Weighted Funding Rate stance at 0.0072% on Thursday, up from -0.0006% the previous day, indicates that traders are piling into long positions. Demand for XRP derivatives must continue to rise to steady the token’s short-term recovery.
Technical outlook: XRP accelerates downtrend
XRP is extending its down leg toward April lows of $1.61 as investors aggressively reduce exposure, citing high volatility on Friday. The token is positioned significantly below the 50-period, the 100-period, and 200-period Exponential Moving Averages (EMAs), all descending on the 4-hour chart and bearishly aligned. This outlook reinforces a downtrend structure likely to cap attempts at recovery in the short term.
The Moving Average Convergence Divergence (MACD) indicator (blue line) remains below the signal line (red) and under the zero mark, with a widening negative histogram that suggests intensifying downside momentum.
The Relative Strength Index (RSI) stands at 23 (oversold), indicating prolonged selling pressure. If the RSI stabilizes, it could precede a corrective bounce. A contraction in the negative MACD histogram alongside an RSI uptick would hint at stabilization, whereas continued expansion would keep the risk skewed toward the April low at $1.61.
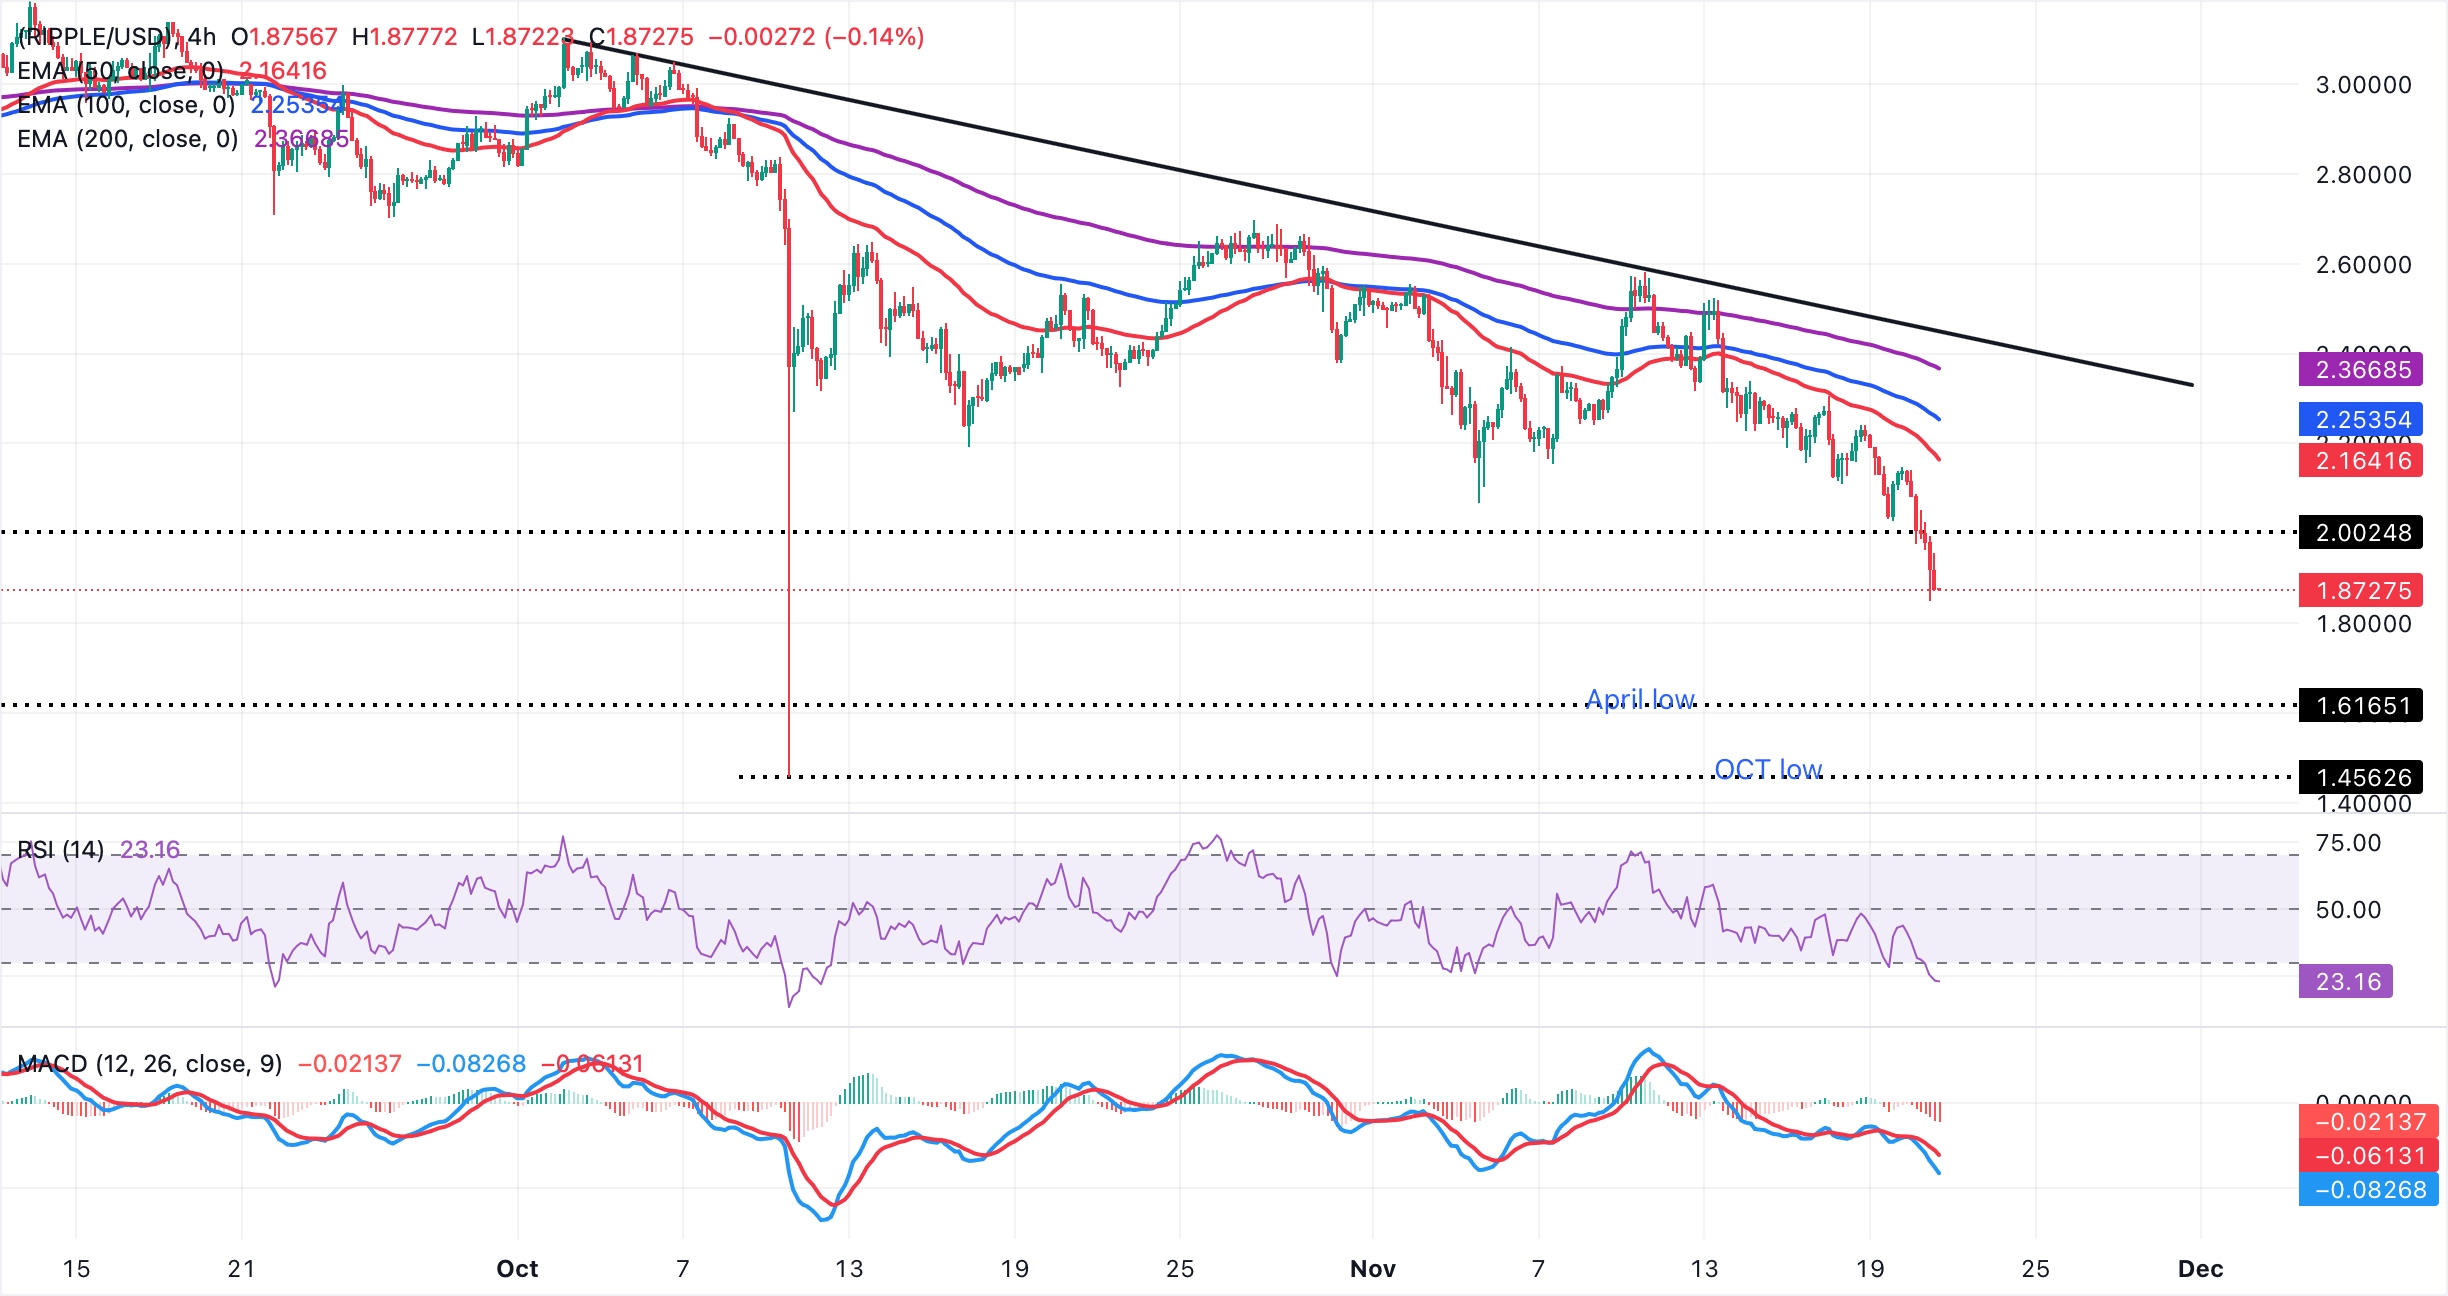
The descending trend line from $3.10 caps recovery, with resistance seen at $2.44, keeping the topside limited unless momentum turns decisively. Any rebound would face headwinds at the falling short-term 50-day EMA ($2.16). Bears would retain control unless price reclaims this level on a closing basis.
Cryptocurrency metrics FAQs
The developer or creator of each cryptocurrency decides on the total number of tokens that can be minted or issued. Only a certain number of these assets can be minted by mining, staking or other mechanisms. This is defined by the algorithm of the underlying blockchain technology. On the other hand, circulating supply can also be decreased via actions such as burning tokens, or mistakenly sending assets to addresses of other incompatible blockchains.
Market capitalization is the result of multiplying the circulating supply of a certain asset by the asset’s current market value.
Trading volume refers to the total number of tokens for a specific asset that has been transacted or exchanged between buyers and sellers within set trading hours, for example, 24 hours. It is used to gauge market sentiment, this metric combines all volumes on centralized exchanges and decentralized exchanges. Increasing trading volume often denotes the demand for a certain asset as more people are buying and selling the cryptocurrency.
Funding rates are a concept designed to encourage traders to take positions and ensure perpetual contract prices match spot markets. It defines a mechanism by exchanges to ensure that future prices and index prices periodic payments regularly converge. When the funding rate is positive, the price of the perpetual contract is higher than the mark price. This means traders who are bullish and have opened long positions pay traders who are in short positions. On the other hand, a negative funding rate means perpetual prices are below the mark price, and hence traders with short positions pay traders who have opened long positions.
(The technical analysis of this story was written with the help of an AI tool)


