


- EUR/JPY tests the immediate barrier at the crucial level of 178.50.
- The 14-day Relative Strength Index holds above the 50 level, reinforcing the bullish bias.
- The primary support lies at the psychological level of 178.00.
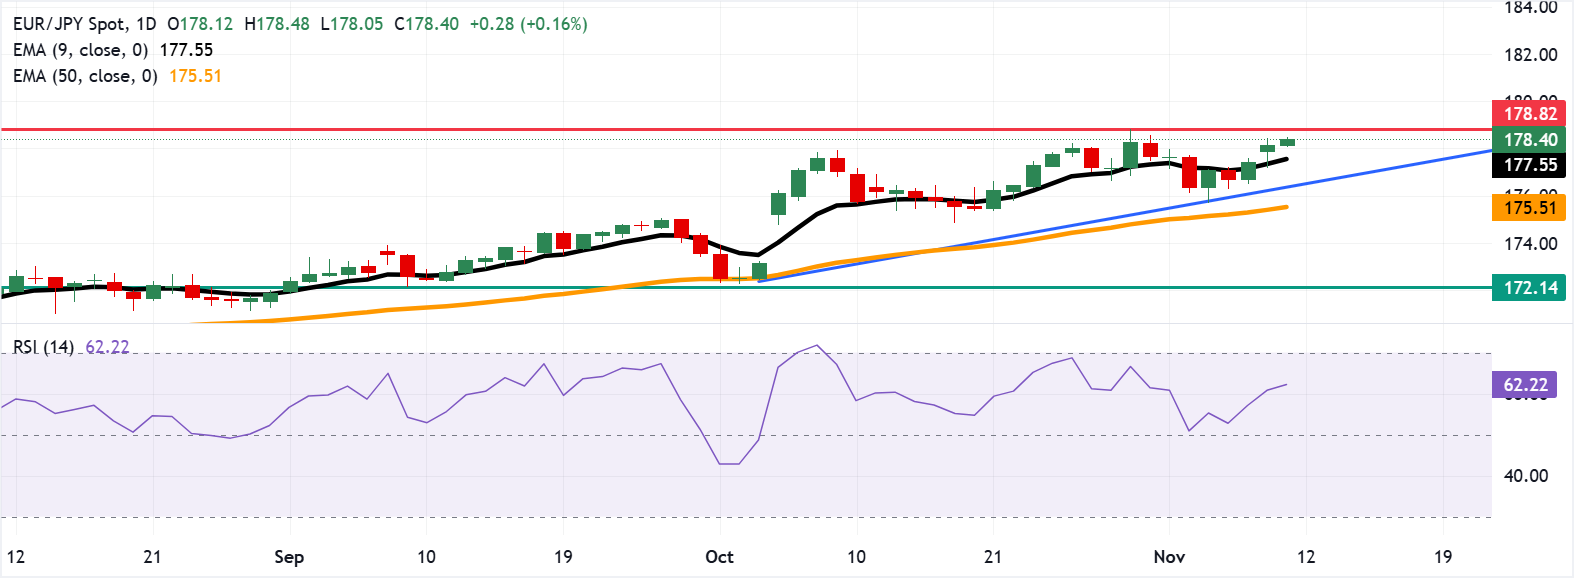
EUR/JPY extends its gains for the third consecutive session, trading around 178.40 during the European hours on Tuesday. The currency cross shows strong short-term momentum, trading above the nine-day Exponential Moving Average (EMA). Moreover, the 14-day Relative Strength Index (RSI) remains above 50, signaling a strengthening bullish bias.
On the upside, the EUR/JPY cross tests the crucial level of 178.50, followed by the all-time high of 178.82, reached on October 30, near the psychological level of 179.00. Further advances above this confluence resistance area would open the doors for the currency cross to explore the region around the psychological level of 180.00.
The immediate support lies at the psychological level of 178.00, followed by the nine-day EMA at 177.55. A break below the latter would weaken the short-term price momentum and prompt the EUR/JPY cross to test the ascending trendline around 176.50, followed by the 50-day EMA at 175.51.
Further declines below the 50-day EMA would dampen the medium-term price momentum and cause the emergence of the bearish bias and put downward pressure on the EUR/JPY cross to navigate the region around the two-month low of 172.14, which was recorded on September 9.
Euro Price Today
The table below shows the percentage change of Euro (EUR) against listed major currencies today. Euro was the strongest against the British Pound.
| USD | EUR | GBP | JPY | CAD | AUD | NZD | CHF | |
|---|---|---|---|---|---|---|---|---|
| USD | 0.04% | 0.41% | 0.19% | 0.10% | 0.27% | 0.02% | -0.14% | |
| EUR | -0.04% | 0.37% | 0.14% | 0.06% | 0.23% | -0.01% | -0.18% | |
| GBP | -0.41% | -0.37% | -0.22% | -0.30% | -0.17% | -0.39% | -0.54% | |
| JPY | -0.19% | -0.14% | 0.22% | -0.09% | 0.08% | -0.18% | -0.33% | |
| CAD | -0.10% | -0.06% | 0.30% | 0.09% | 0.17% | -0.09% | -0.24% | |
| AUD | -0.27% | -0.23% | 0.17% | -0.08% | -0.17% | -0.24% | -0.46% | |
| NZD | -0.02% | 0.00% | 0.39% | 0.18% | 0.09% | 0.24% | -0.16% | |
| CHF | 0.14% | 0.18% | 0.54% | 0.33% | 0.24% | 0.46% | 0.16% |
The heat map shows percentage changes of major currencies against each other. The base currency is picked from the left column, while the quote currency is picked from the top row. For example, if you pick the Euro from the left column and move along the horizontal line to the US Dollar, the percentage change displayed in the box will represent EUR (base)/USD (quote).


