
AUD/USD rises toward 0.6920 as sentiment improves, Iran wary
By Christian Borjon Valencia
Updated: 6 Apr 2026


POPULAR ARTICLES
The Australian Dollar rallied by over 0.50% amid an improvement in risk appetite, though gains were capped by Iran’s rejection of a ceasefire deal, pushing traders to trim long positions in the AUD/USD pair. At the time of writing, the pair trades at 0.6918, still above its opening price.
- AUD/USD recovers, boosted by an Improved risk appetite.
- Iran’s rejection of the ceasefire trimmed gains and kept traders cautious near highs.
- Fed minutes, inflation data and Australian releases now guide direction.
The Australian Dollar rallied by over 0.50% amid an improvement in risk appetite, though gains were capped by Iran’s rejection of a ceasefire deal, pushing traders to trim long positions in the AUD/USD pair. At the time of writing, the pair trades at 0.6918, still above its opening price.
Aussie gains as risk mood lifts, but ceasefire doubts cap upside
Wall Street ended Monday’s session in the green, though beneath daily highs on news that the US is preparing for strikes on Iran, according to the Wall Street Journal. Although Trump reported that talks with Iran are “going well,” he insisted that free flow through the Strait of Hormuz is a must.
In the meantime, the Aussie Dollar retreated from daily highs amid uncertainty in the Middle East, as mixed headlines across most newswires kept investors on their toes.
US business activity in the services sector fell short of economists' estimates for a 54.9 slowdown. The ISM Services PMI in March dipped from 56.1 to 54.0, while the Prices Paid sub-component soared sharply to its highest level since 2022, coming at 70.7 due to higher petrol prices
After the data and Iran’s rejection of the ceasefire deal, the US Dollar Index (DXY), which measures the value of the Greenback against six currencies, edged past 100.00, trimming earlier losses. Nevertheless, as traders digested the news, the DXY reversed its course, aiming towards daily lows, down 0.20% at 99.98.
In Australia, trading activities resume on April 7, following the four-day long weekend. The S&P Global Services PMI in March is expected to remain steady at 46.6, as in February, an indication that the services sector remains in contractionary territory.
Other data is expected, including the TD-MI inflation gauge from the Melbourne Institute, which provides a monthly measure of inflation in the country.
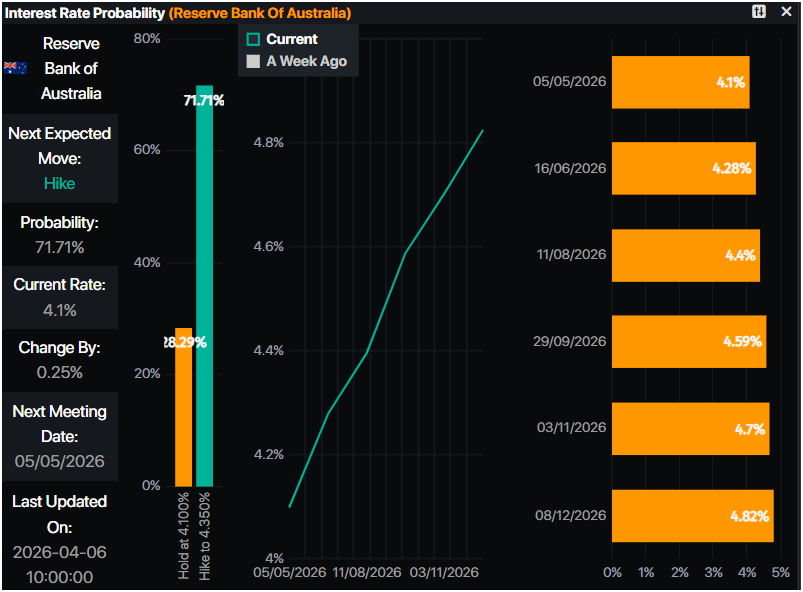
A poll by the Australian Financial Review (AFR) revealed that most of the 38 economists surveyed expected the Reserve Bank of Australia (RBA) to raise interest rates to 4.35%, the third time this year. The poll revealed that “Westpac and Judo Bank are forecasting three more increases by June next year, taking the cash rate to its highest since the global financial crisis.”
RBA interest rate probabilities
In the US, a busy calendar will keep traders on edge, with key releases including Durable Goods Orders, Fed speakers, FOMC minutes, GDP data, Jobless Claims, and inflation prints.
AUD/USD Price Analysis: Technical outlook
In the daily chart, AUD/USD trades at 0.6919. The near-term bias is mildly bullish as spot holds above the clustered rising support lines that have been underpinning the advance from the 0.67 area, while price also trades above the grouped simple moving averages around 0.70, which now trail the move and reinforce the broader uptrend. RSI at 44 stays below the midline but has stabilised after a prior decline, suggesting fading downside momentum rather than outright bearish pressure, consistent with a corrective phase within a still-positive daily structure.
Initial support emerges at the recent low near 0.6850, reinforced by the latest upward-sloping trend-line zone drawn from 0.6897, with a break there exposing deeper pullback potential toward 0.6800. On the upside, the first resistance is aligned with last week’s reaction high around 0.7020, followed by the 0.7075/0.7120 band, where prior swing highs converge and the rising average cluster begins to cap, and a sustained close above this band would reopen the path toward the mid-0.71s.
(The technical analysis of this story was written with the help of an AI tool.)
Australian Dollar Price Today
The table below shows the percentage change of Australian Dollar (AUD) against listed major currencies today. Australian Dollar was the strongest against the US Dollar.
| USD | EUR | GBP | JPY | CAD | AUD | NZD | CHF | |
|---|---|---|---|---|---|---|---|---|
| USD | -0.23% | -0.30% | -0.03% | -0.26% | -0.37% | -0.45% | -0.24% | |
| EUR | 0.23% | -0.05% | 0.18% | -0.02% | -0.16% | -0.24% | -0.03% | |
| GBP | 0.30% | 0.05% | 0.23% | 0.00% | -0.10% | -0.20% | 0.04% | |
| JPY | 0.03% | -0.18% | -0.23% | -0.21% | -0.35% | -0.44% | -0.22% | |
| CAD | 0.26% | 0.02% | -0.00% | 0.21% | -0.11% | -0.21% | 0.01% | |
| AUD | 0.37% | 0.16% | 0.10% | 0.35% | 0.11% | -0.10% | 0.13% | |
| NZD | 0.45% | 0.24% | 0.20% | 0.44% | 0.21% | 0.10% | 0.24% | |
| CHF | 0.24% | 0.03% | -0.04% | 0.22% | -0.01% | -0.13% | -0.24% |
The heat map shows percentage changes of major currencies against each other. The base currency is picked from the left column, while the quote currency is picked from the top row. For example, if you pick the Australian Dollar from the left column and move along the horizontal line to the US Dollar, the percentage change displayed in the box will represent AUD (base)/USD (quote).

More than a million users rely on FXStreet for real-time market data, charting tools, expert insights, and forex news. Its comprehensive economic calendar and educational webinars help traders stay informed and make calculated decisions. FXStreet is supported by a team of about 60 professionals, split between the Barcelona headquarters and various global regions.
Read More


